What is one part of your lessons you always feel confident about when planning? Why?
As an artist, I am always confident in designing learning experiences that are unique, memorable, and unlike anything found in a standard curriculum template. Most of my lesson plans are built entirely from scratch and rooted in my personal experiences as a working artist. Because of this untraditional approach, I visualize the artistic process first—imagining how students will move, create, and problem‑solve—and then I identify the learning targets and success criteria that naturally emerge from that process.
This ensures that both skills and knowledge are actively engaged in my classroom. I can confidently tell my students that the activities we do, and the ways they learn with me, are experiences they will not encounter in another art class or with another art teacher.
What is one part of your lessons that you are really intentional about or is a non‑negotiable for you? Why?
Every art lesson I teach is grounded in my personal philosophy and core principles, regardless of the specific content. These non‑negotiables include:
Art is a process, not a product — focus on creativity through exploration, trials & errors
Focus on effort, not materials — effort is a skill that transfers to every subject
Practice makes perfect, not a first attempt—the more you do it, the prettier it’ll look
Patience is a virtue, not a waiting period — art teaches students to slow down and think deeply
I emphasize these principles because they are the foundation for learning anything—not just art. Many students come into specials classes with the misconception that they are “not real classes,” and they often shift into a different mindset than they would in a general education setting.
To counter this, I intentionally integrate academics such as history, geometry, and literature into my art lessons. By blending subject areas, I blur the boundaries between specials and general education. My art‑infused lessons reinforce and extend what students are learning elsewhere, helping them see that art is connected to every part of their education.
What are some ideas you are thinking about implementing into your own learning environment?
As an art teacher, my procedures and classroom rituals differ significantly from those of a general education classroom. They also vary greatly by grade level, as I teach students from PreK through fifth grade. Even among specials teachers, procedures can look very different. It took considerable trial and error for me to establish routines that work effectively in my classroom.
As an artist and graphic designer by training, I created many visual flyers to communicate rules and expectations, especially for younger students who cannot yet read. These visuals are printed and displayed throughout my classroom. I also maintain frequent communication with homeroom teachers and intentionally learn from the classroom management techniques they already have in place.
As a specials teacher, I see approximately 400 students each week, yet I only have 45 minutes with each class. Because of this limited time, I use every minute intentionally. Each art activity helps me learn more about my students’ families, experiences, strengths, and areas for growth. I support students’ individual needs through strategies such as flexible seating arrangements, including placing students with behavioral challenges closer to me.
It took time for me to put effective classroom management practices into place and to continue modifying them based on my students. There is no one-size-fits-all approach—successful management requires flexibility, reflection, and ongoing adjustment.
What are some specific things you have done with respect to each of these areas: ● Attitudes, perceptions, and expectations? ● Student engagement? ● Student achievement?
Recognizing Bias as a Tool for Growth
Recognizing my own biases has been instrumental in improving my classroom management practices. I discovered that I held negative expectations for certain students—those I anticipated would struggle with following directions or who seemed reluctant to engage in art class. Rather than examining the root of their behavior, I unconsciously reinforced those negative patterns by calling them out immediately, spending less time with them, and reducing overall engagement opportunities.
The Impact of Bias on Classroom Climate
This biased approach created a self-fulfilling prophecy and fostered a negative classroom environment that affected the entire class. Students are perceptive; they recognize when they are unwanted or treated differently. When students feel unsupported or unfairly targeted, they disengage, and learning becomes impossible.
Shifting from Reactive to Proactive
Through reflection and intentional practice, I learned to reframe my bias into preparation and motivation. Rather than reacting emotionally to challenging behavior, I now approach these students with rational structure and deliberate support. I reset my initial impressions, adjust my tone, and proactively build relationships with students who need it most. When students experience a teacher responding to challenges with calm, intentional support rather than emotional reaction, they feel valued and cared for in the classroom.
The Teacher’s Role in Creating Climate
Ultimately, students shape classroom dynamics, but teachers control the response. When students understand they are supported rather than punished, they flourish. It is our responsibility as educators to model the emotional regulation and intentionality we hope to cultivate in our students.
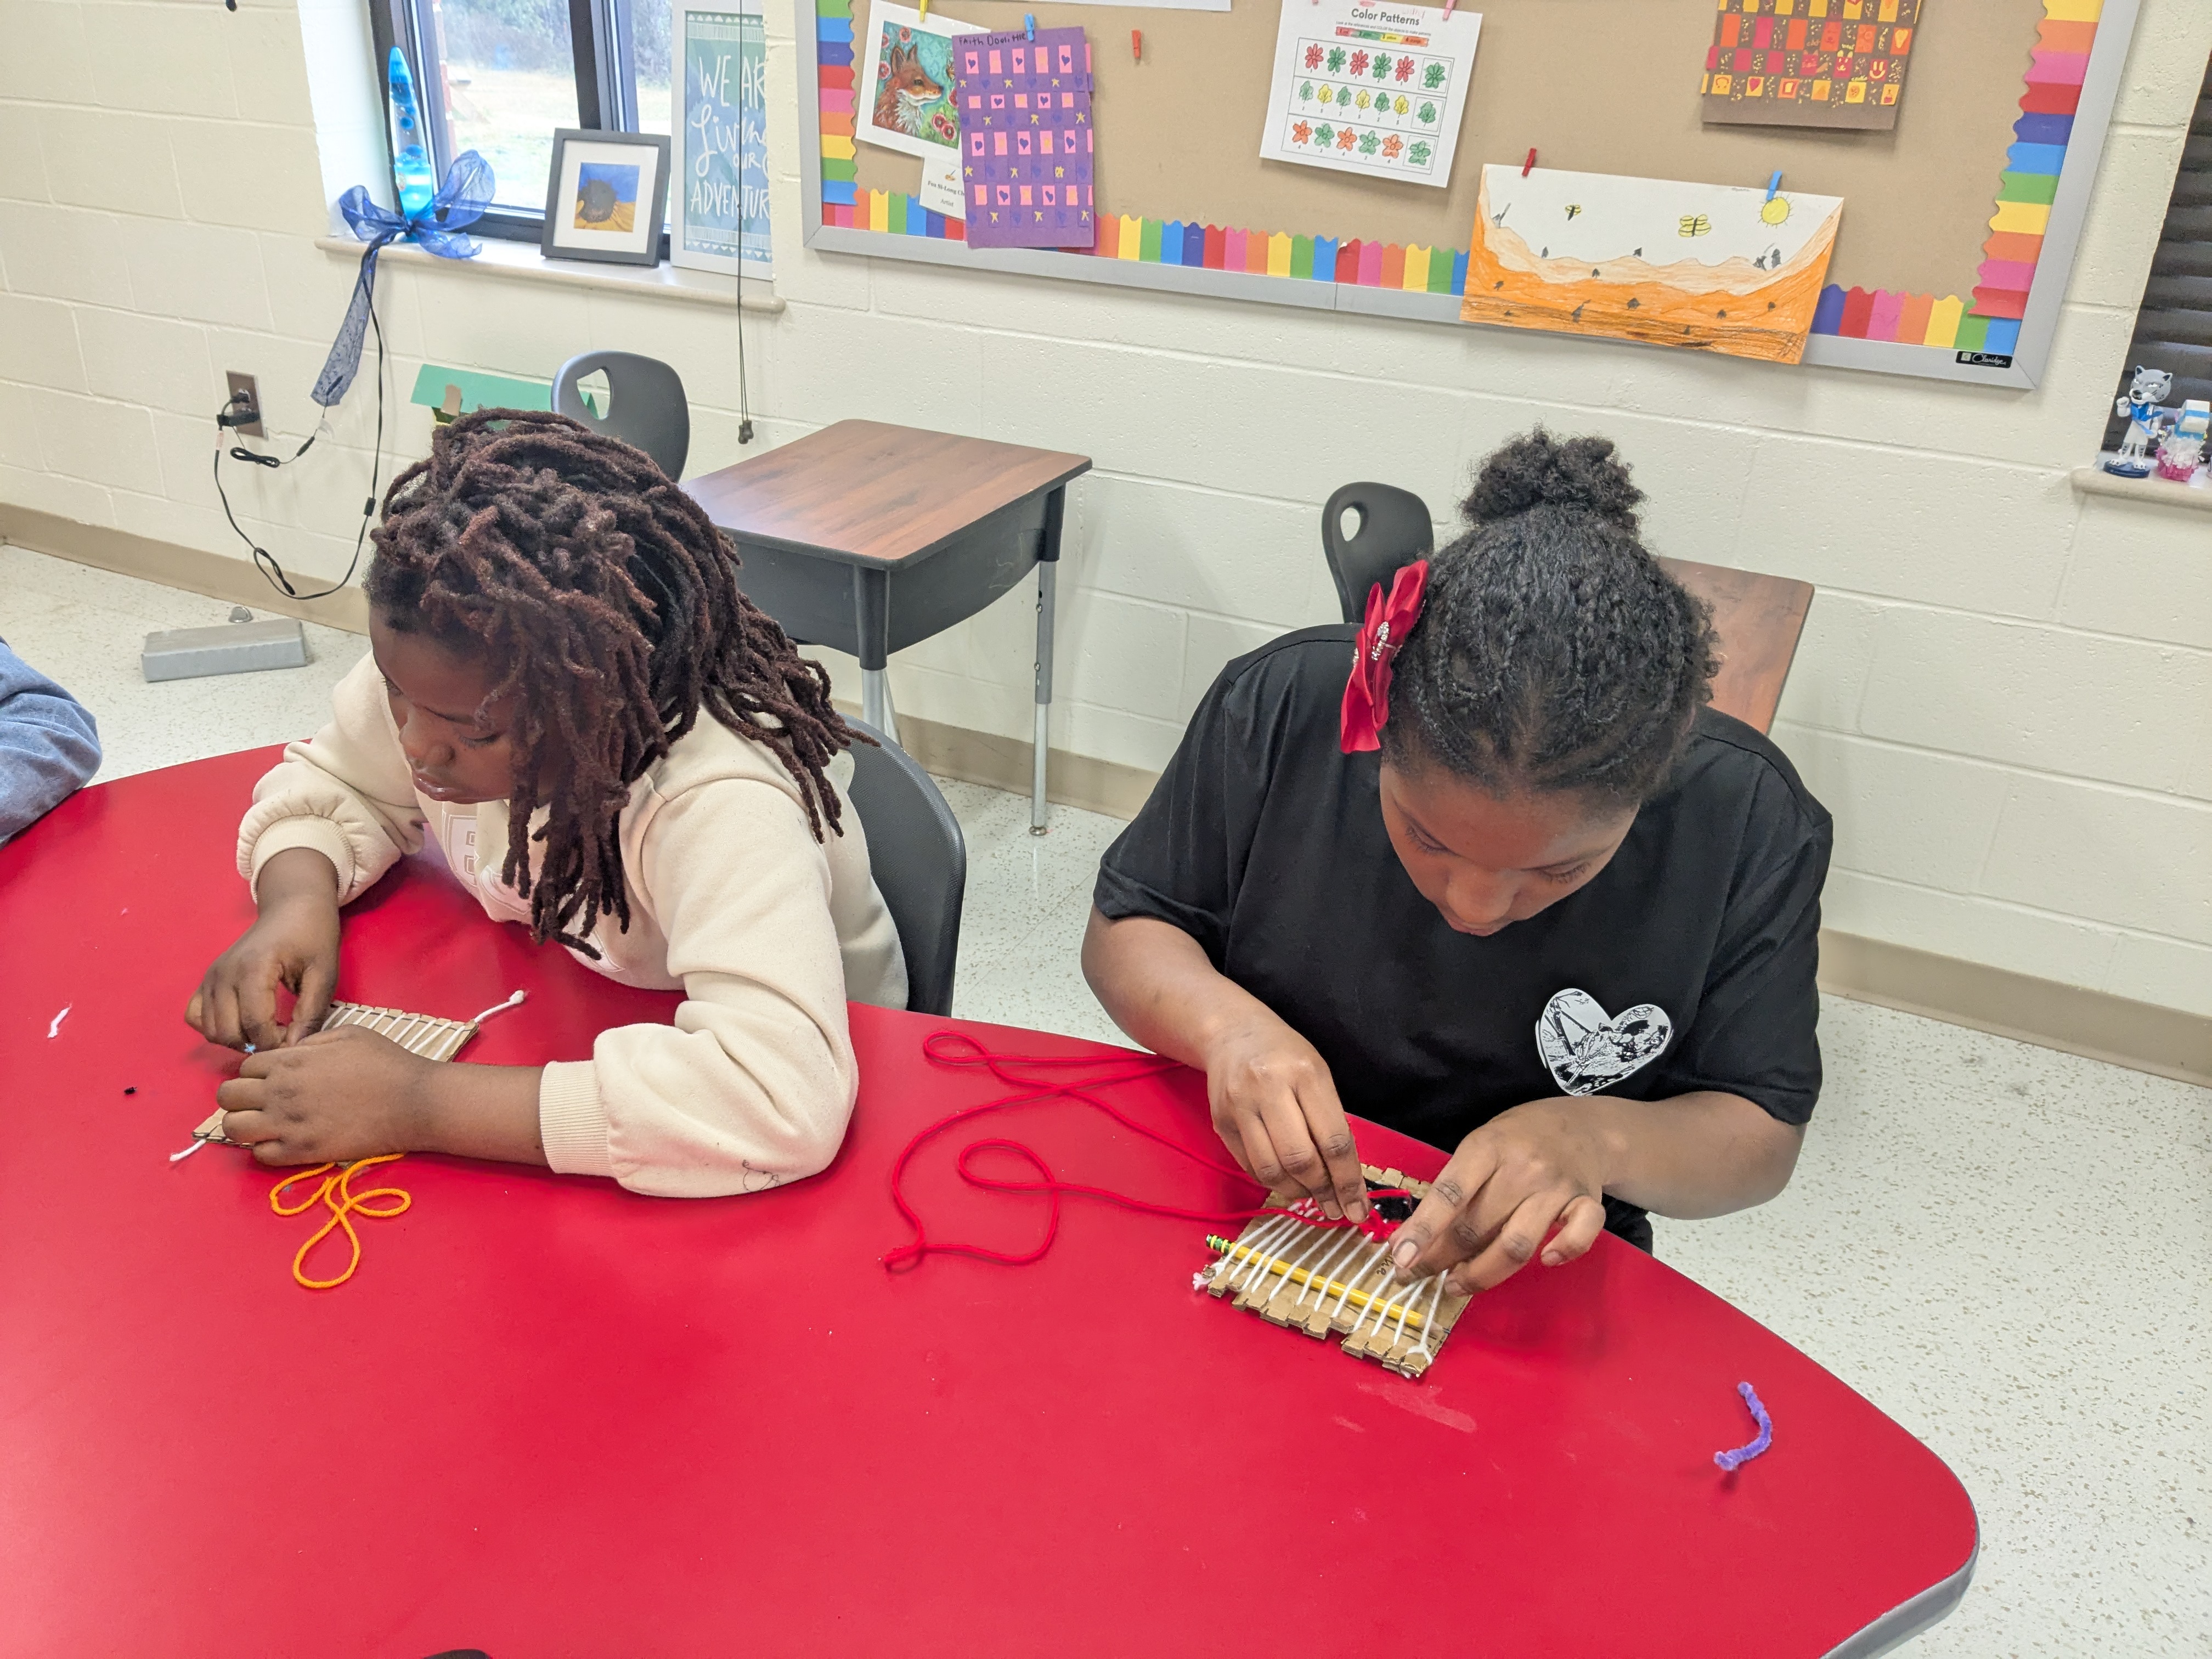
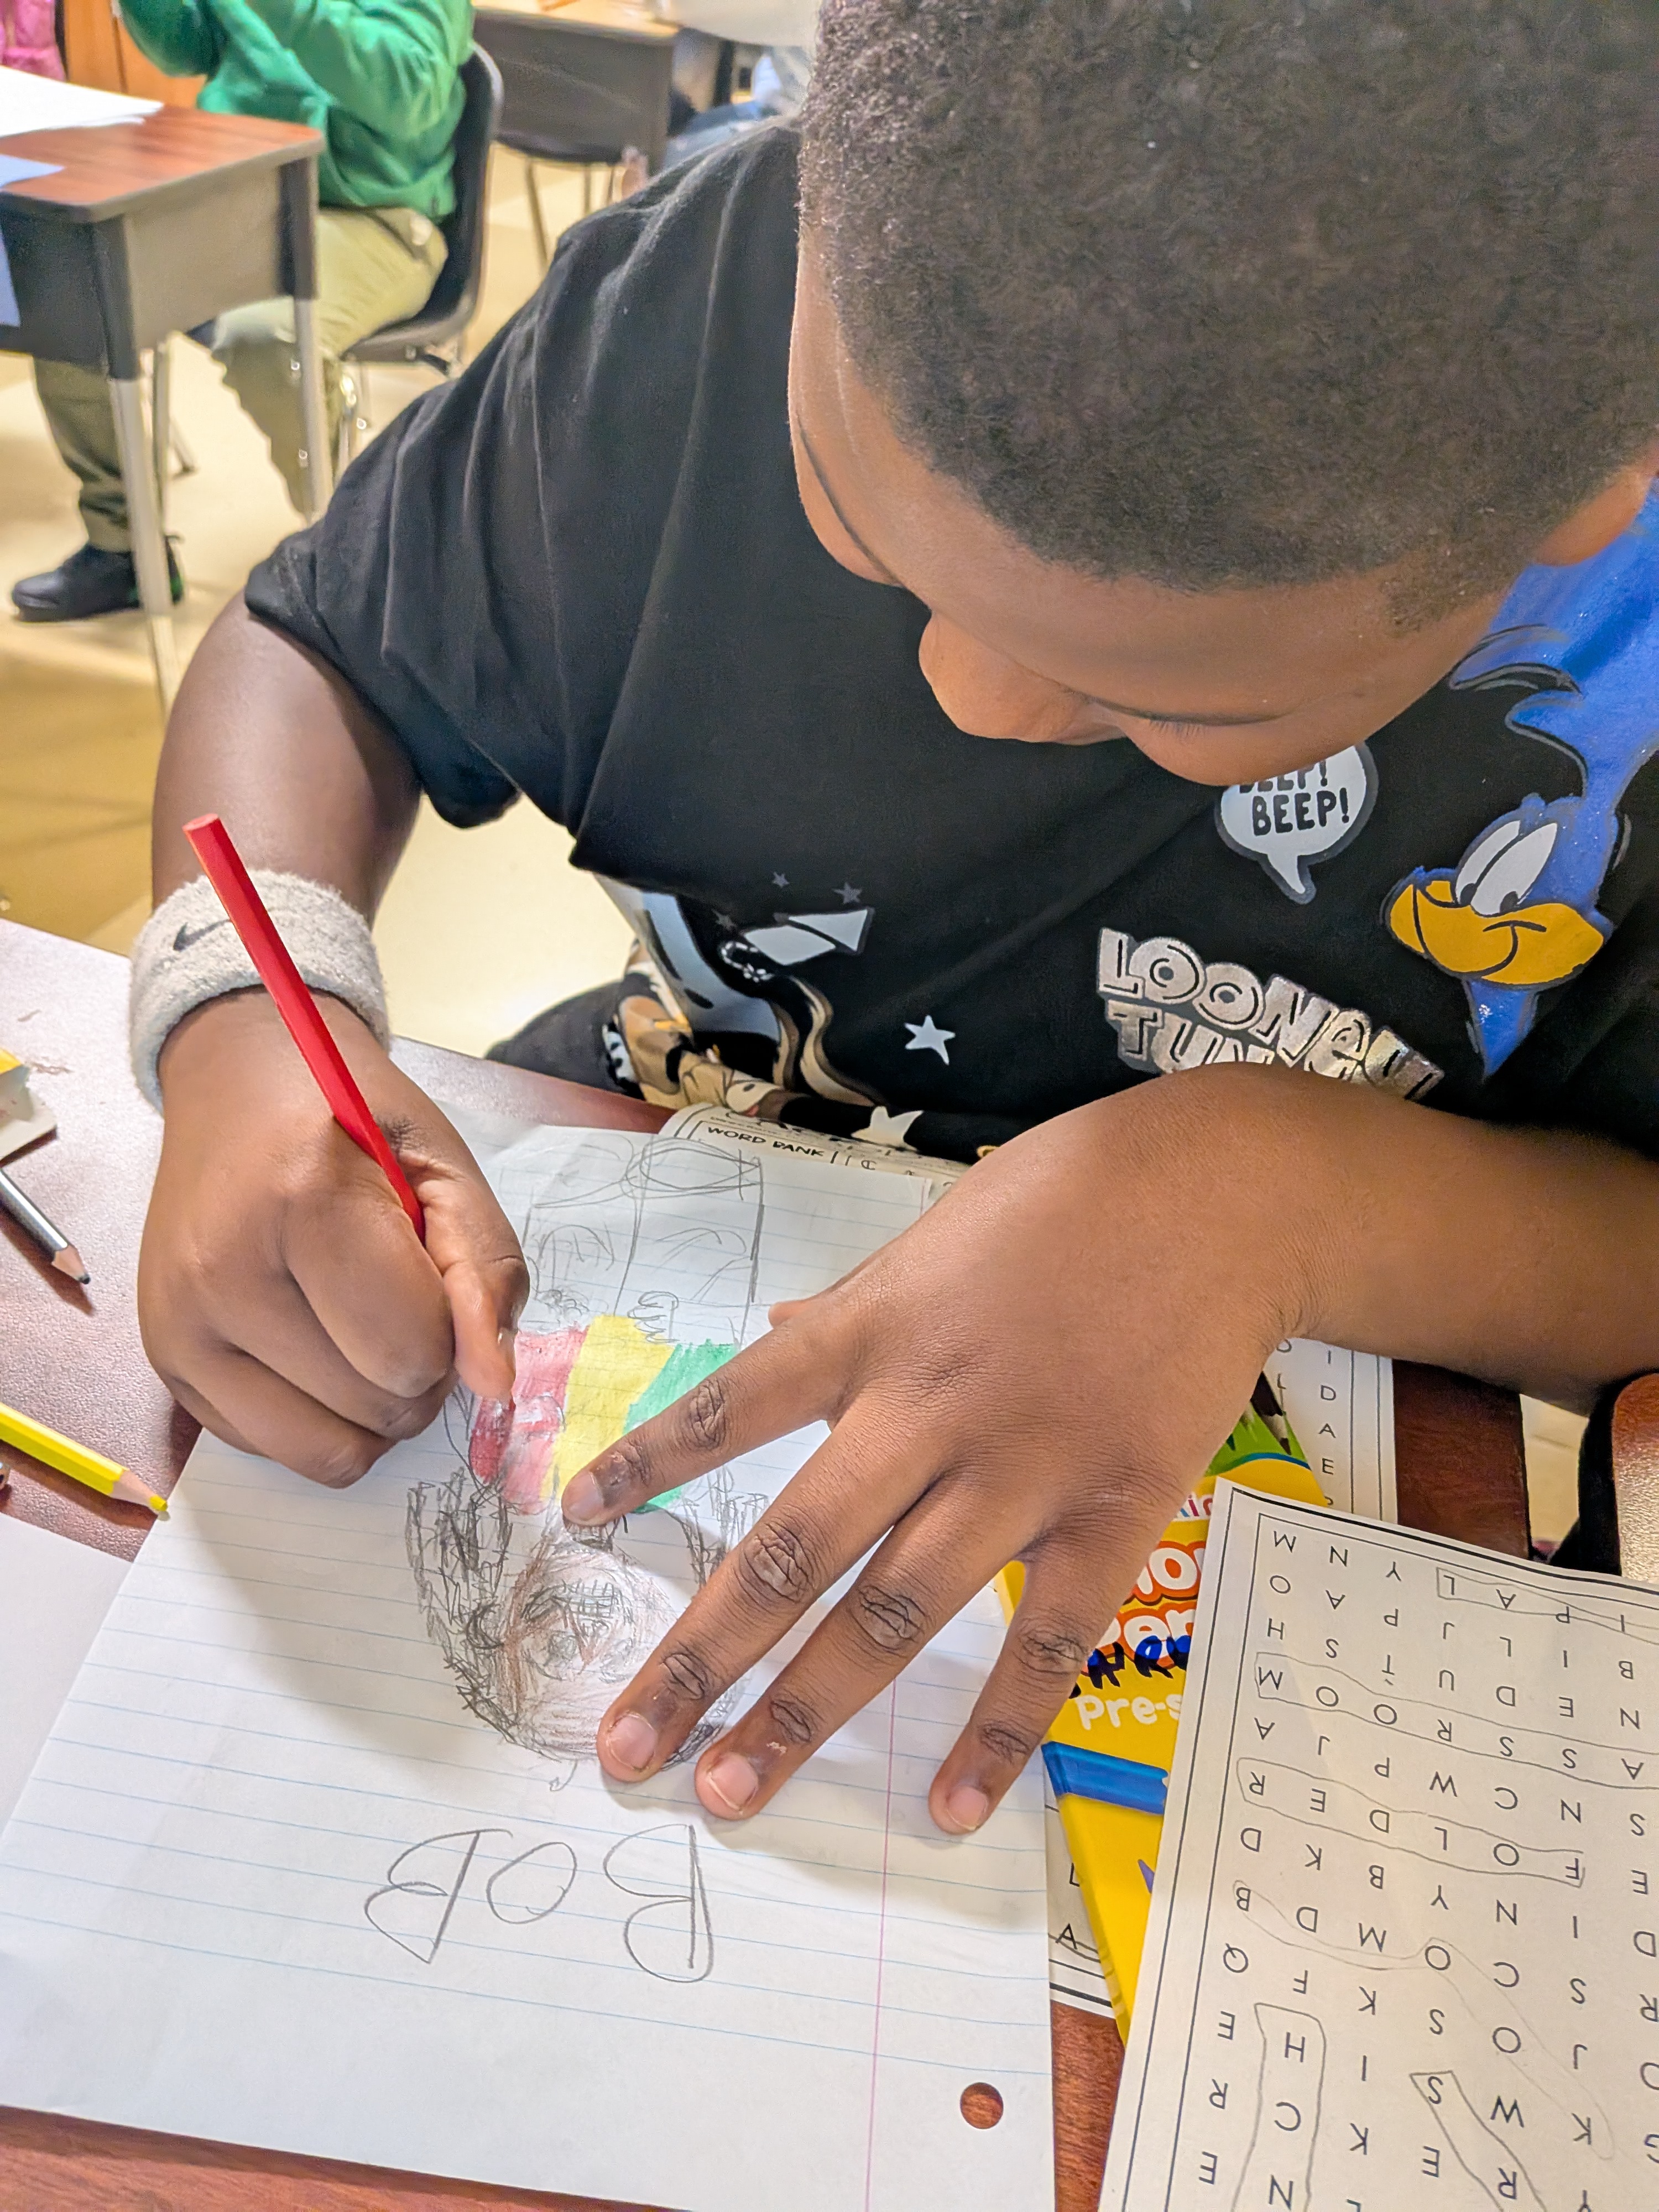
As an art teacher, expression is endless and I’ve learned so much about my students’ mentality through art. I also play a game where I depict the artist based on their artwork without looking at their name.
“This artist must be very bold because of the dark colors and thick amount of paint, etc”
“This artist must be very patient and calm because of the amount of details in this drawing”
Then at the end I’d reveal the student’s name for myself and for the whole class to see if my description was accurate (almost most of the time).
What are some strategies you are using or plan to use to know your students this year?
Little fun note: I have a tendency to mix up sibling’s names. To combat that, I told the student that I will give them a candy if I made a mistake in their name. This is a gateway I slightly open for them to remind me/ correct me if I do something wrong intentionally or unintentionally. I have made several mistakes in my teaching career, forgetting the timer, not passing out all the materials, etc. For my forgetfulness, I encourage my students to remind me and take ownership. I wish use paint brush the wrong way to test to see if they caught on a mistake and describe a way to fix it. I do that in order to promote autonomy in the students.
My art journey began at a young age, and although I did not pursue a degree in art, I have committed to using my talents to make a positive impact. As a freelance artist, I have had the privilege of inspiring young minds and fostering community pride through public murals, exhibitions, and philanthropy. Now, I am at a major turning point in my career, having navigated many twists and turns, where I have become a public educator. My heartfelt gratitude and deepest appreciation go out to my teachers, who empowered me, a behavioral child from a disadvantaged background, to envision a brighter future through their lessons. This has ignited a burning passion for education within me and driven me to create the same life-changing empowerment for others.
My current position as an art teacher has already met a lot of challenges. My classroom has a leak before I even started teaching in 2024. Mostly, the ceiling tiles were replaced. Over time, the leak has gotten worse because of adverse weather. Multiple issues caused the leak, and even now it has not been fully repaired. As a result, I’ve had to travel between 25 classrooms on a cart.
I have already spent a large amount of money, time, and effort in the classroom, lesson plans, and behavioral management. My personal life has also been jeopardized by Hurricane Helene and the ice storms. I still face the difficult task of obtaining the teaching certificate on my own as a requirement to continue my teaching career.
Nevertheless, my passion for teaching shall not extinguish because of these challenges. I set a positive mindset and maintain resilience, the same way that I have taught my students. I remain steadfast in my commitment as a rising teacher. I firmly believe that education has the power to transform lives, and I am eager to continue making a meaningful difference in the lives of my students.
I am currently working as a non-traditional art teacher, who is looking to obtain my certification. My current employer does not offer any financial support through the journey, and thus, I am requesting funding for the mandatory tests, classes, and materials as follows: Georgia Assessments for the Certification of Educators (GACE) The Art Education assessment consists of two subtests; a combined version of the tests is also offered. Test I (109) 5/20/2025 – $123 Test II (110) (TBD) – $123 Central Savannah River Area – Regional Educational Service Agency – Teacher Academy for Preparation and Pedagogy (CSRA -RESA – GaTAPP) TAPP is set up as a two-year program but could be expedited to one-year; The tuition for the program is pay $1500.00 per semester at the beginning of each semester or $4,500.00 for the year. Monthly payments of $375.00 will begin the month you enroll in the TAPP program and continue each month until the completion of the TAPP program. The application fee for the program is $40.00. Official transcript $10. There are three semesters each school year. Each semester is four months in length: May – August September – December, and January – April If I didn’t have to retake my GACE tests and could finish the program in 1 year, I would be looking at a minimum of $4,786. If I had to retake tests and finish the program in 2 years, I would be looking at upwards of $9,542.
Date: Monday, May 16, 2022 Time: 6 pm Location: Sacred Heart Cultural Center of Augusta, Ga 1301 Greene St, Augusta, GA 30901 Description: Starry night theme; Color pattern: Navy blue, gold, ivory
Notes: RSVP is closed. You will not be able to attend the wedding without RSVP.
Hotel Instructions
Thank you for considering the Hyatt House Downtown Augusta to host your wedding guests May 12-17, 2022. Below are instructions how to make a reservation and receive the discount.
Please go to our website, www.hyatt.com › hyatt-house-augusta-downtown › agsxa
Put in the dates of arrival and departure. Under departure date, go to “Special Rates”. Click on the down arrow and you will see “Corporate or Group Code”. Enter 85917, which is the wedding code. Click Book Now.
All room types available and the discounted rates will pull up. Rates are based on the hotel’s availability at the time of booking.
Or you can call Reservations at 866-994-9288 and give the code WEDA.
It is possible that the wedding discount will become invalid should the hotel availability decrease.
*Note: Wedding weekends are especially busy. Hotel check-in is 3:00pm (check out is 12:00 noon.) If you or your guests need to get ready for an event, do not rely on early check-in. We advise you to reserve the room the day prior.
Bridal Shower
Date: Saturday, May 14, 2021
Time: 1 to 5 pm Location: Ministerio Nueva Vida (1755 Gordon Hwy, Augusta, GA 30904)
Open to all genders. Afternoon sparkling grape juice, veggie plate, charcuterie, dessert and coffee. Paint starry night or other night skies/ star paintings Gifts and games Si-Ing (maid of honor) homemade tiramisu, creme brulee, and red velvet. Pastora and CJ homemade quesitos.
Please RSVP to attend! It will help us a lot in organizing and planning.
Atlanta’s Political Structure, Key Partnerships, City Management, Best policies
Regarding the structure of the city government, the City of Atlanta has more of a reform model rather than a political model. According to Robert England (2017), the reform agenda includes a council-manager plan, nonpartisan ballots, and at-large constituencies part of the progressive era. However, as the state’s capital, it gets a strong influence on a political model as well. In short sum, the city has a mixture of both models. As a city of Georgia, Atlanta has a reform model, but as Georgia’s capital and the headquarter of the Georgia State Governor’s Office, it has a political model.
Like the City of Augusta, Atlanta has a government structure with a mayor and special districts with commissioners. The commissioners also serve different roles in the different branches of Atlanta’s executive offices. Atlanta has both a mayor, the executive branch, and a city council team, which serves as the legislative branch. The president of the city council service kind of like a vice-major in the structure. There are also three other at-large councilmen (the City of Atlanta, Ga, 2021). While mayor-council governments are typical in the smallest and largest municipalities, the council-manager plan is popular with the mid-sized city (England, 2017). Contrastingly, unlike Augusta, The City of Atlanta and Fulton County are not consolidated. Atlanta is unique for its dual approach; this type of government structure has many red tapes and is not as efficient.
Atlanta has a Chief of Staff that serves as an advisor to the mayor, acting as a City Administrator. Mayor Keisha Lance Bottoms serve as the executive officer, similar to an administrator who has the power to execute and enforce provisions of all departments of the city. Atlanta has 15 different offices and agencies (the City of Atlanta, Ga, 2021). Furthermore, instead of a City Manager, the City of Atlanta employs a Chief Operating Officer (COO). The COO “directly manages and oversees all city operating departments and related agencies including Aviation, Police, Fire, Corrections, Parks, Recreation and Cultural Affairs, Planning and Community Development, Public Works, Watershed Management, Human Resources, Procurement, Information Technology, Sustainability and Enterprise Assets.” (the City of Atlanta, Ga, 2021)
One of the policies that I appreciate is the formation of diverse committees. Atlanta also has different committees and councils that are comprised of members-at-large in the local community. These are non-paid positions and representatives of the community. For example, the Confederate Monuments Advisory Committee comprises many business owners, education leaders, and directors of non-profits (the City of Atlanta, Ga, 2021). Furthermore, Atlanta Fulton County engages with citizens by offering public participation to their board meeting via zoom and form a focus group to survey for social research. In addition to that, Atlanta also has reports available for download and states a straightforward way to contact them on their website (Mosaic Community Planning, 2019).
Another policy that Atlanta had seen success in is its incentives for fostering public-private partnerships. The City Council has signed contracts with private developers on projects like LCI to create a more sustainable redevelopment project. An excellent example from the past is the Livable Centers Initiative (LCI) plan; it focused on transit-oriented development in the city’s planning efforts (Department of Planning and Community Development, 2016). Public and private partnerships with business, financial and non-profit communities are key to spurring quality job creation and investment throughout the city’s neighborhoods (the City of Atlanta, Ga, 2021). Atlanta’s Bureau of Planning and Development provided information and advice to the mayor and city council, and other city officials to assist them in making decisions about the growth and development of the city. It also collaborates with non-profit organizations such as the Historic District Development Corporation.
Overview of Atlanta’s Community
Listed as the 9th largest Metropolitan Statistical Area in the United States, the City of Atlanta, Georgia, was founded in 1837. Its 2015, the population was an estimated 437,077 (Department of Planning and Community Development, 2016). The majority of Atlanta, around 90%, is in Fulton County; the other 10% is in DeKalb County The racial composition of Atlanta in 2014 was estimated to be 53% black, 40% white, 5% Hispanic origins, 4% Asians, and 2% two or more (Department of Planning and Community Development, 2016).
Atlanta full-heartedly embraces diversity, as it is coined the birthplace of civil rights. The city learned from its long mistake of segregation and made a breakthrough during civil rights. The city’s comprehensive plan credits its vibrant economy to the diversity of its people, places, activities. The city stated that diversity, connectivity, and synergy are among its development principles (Department of Planning and Community Development, 2016). There are 12 districts that organize the city. Council President is elected from the city at large. The council consists of 15 members, 12 elected from single-member districts and three elected at-large.
Atlanta’s Community Assets
Downtown Atlanta is a very bikeable, walkable, and pedestrian-oriented community. The city’s continuing effort to offer various safe and affordable transportation options, such as sidewalks, streetscapes, greenway trails, bike lanes, and handicap accessibility. In recent years, the City converted shared bike-automobile lanes and a few parking spaces to designated bike lanes around Piedmont Park (Department of Planning and Community Development, 2016).
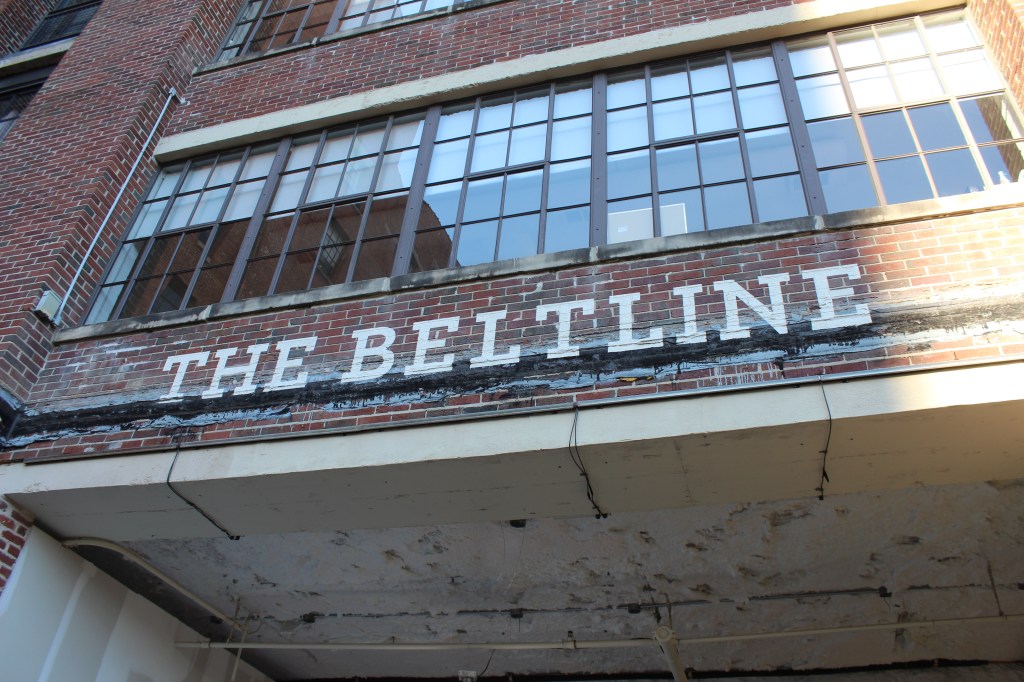
Atlanta is well known for its BeltLine, connected to Ponce City Market, residential lofts, public transit, and is walk and bike-friendly. According to the Department of Planning and Community Development (2016), the agency, Atlanta BeltLine, Inc., connected 45 in town neighborhoods via a 22-mile of repurposed old railroad tracks that encircled the city.
Another feature that Atlanta attracts people to move there is that the economy of the city is very prosperous and sustainable. The metro area alone is home to Delta Airlines, Coca-Cola, the world’s largest aquarium, and over a dozen other Fortune 500 companies. Atlanta continues to be an attraction and hub for business as it is home to the world’s busiest airport. “The Metropolitan Atlanta Chamber of Commerce and the City of Atlanta are committed to actively recruiting new companies to the region” (the City of Atlanta, Ga, 2021).
Last but not least, my personal favorite about Atlanta is that it is known for diversity in people, culture, and cuisine. There are many concentrated areas of minority-owned businesses in the surrounding metropolitan area. A notable example is the stretch of Buford Highway NE, in Doraville, which contains many Asian-owned businesses. Furthermore, the City of Atlanta (2021) encourages diversity of languages as well. Per Code of Ordinance sec. 114-140, the City incentivizes employees who speak a second language or are willing to learn another language, particularly Spanish. Employees have to maintain their proficiency to continue this bonus.
Residents of Atlanta’s quality of life
Atlanta is aprosperous city that draws many residents to move there. The city is very progressive, inclusive, and has many high-caliber economic opportunities. Atlanta is the South’s shining star, a vibrant city with an outstanding quality of life. The city government’s focus on teamwork with private organizations continues to pursue intelligent economic development that benefits all Atlanta’s residents.
As Georgia’s capital, it is hard to miss the compelling statistics on Atlanta’s success as a business hub. Several startup companies or independent developers can uncover Atlanta’s support and resources for small businesses and entrepreneurs. Explore our blueprint for livable urban design and workforce development ideas. The metro Atlanta area is home to 13 Fortune 500 and 24 Fortune 1000 headquarters (Department of Planning and Community Development, 2016). The Metropolitan Atlanta Chamber of Commerce, corporate executives, relocation consultants, and Mayor Keisha Lance Bottoms are committed to actively recruiting new companies to the region. Public and private partnerships with business, financial and non-profit communities are key to spurring quality job creation and investment throughout the city’s neighborhoods.
Atlanta’s economic, environmental, and social sustainability
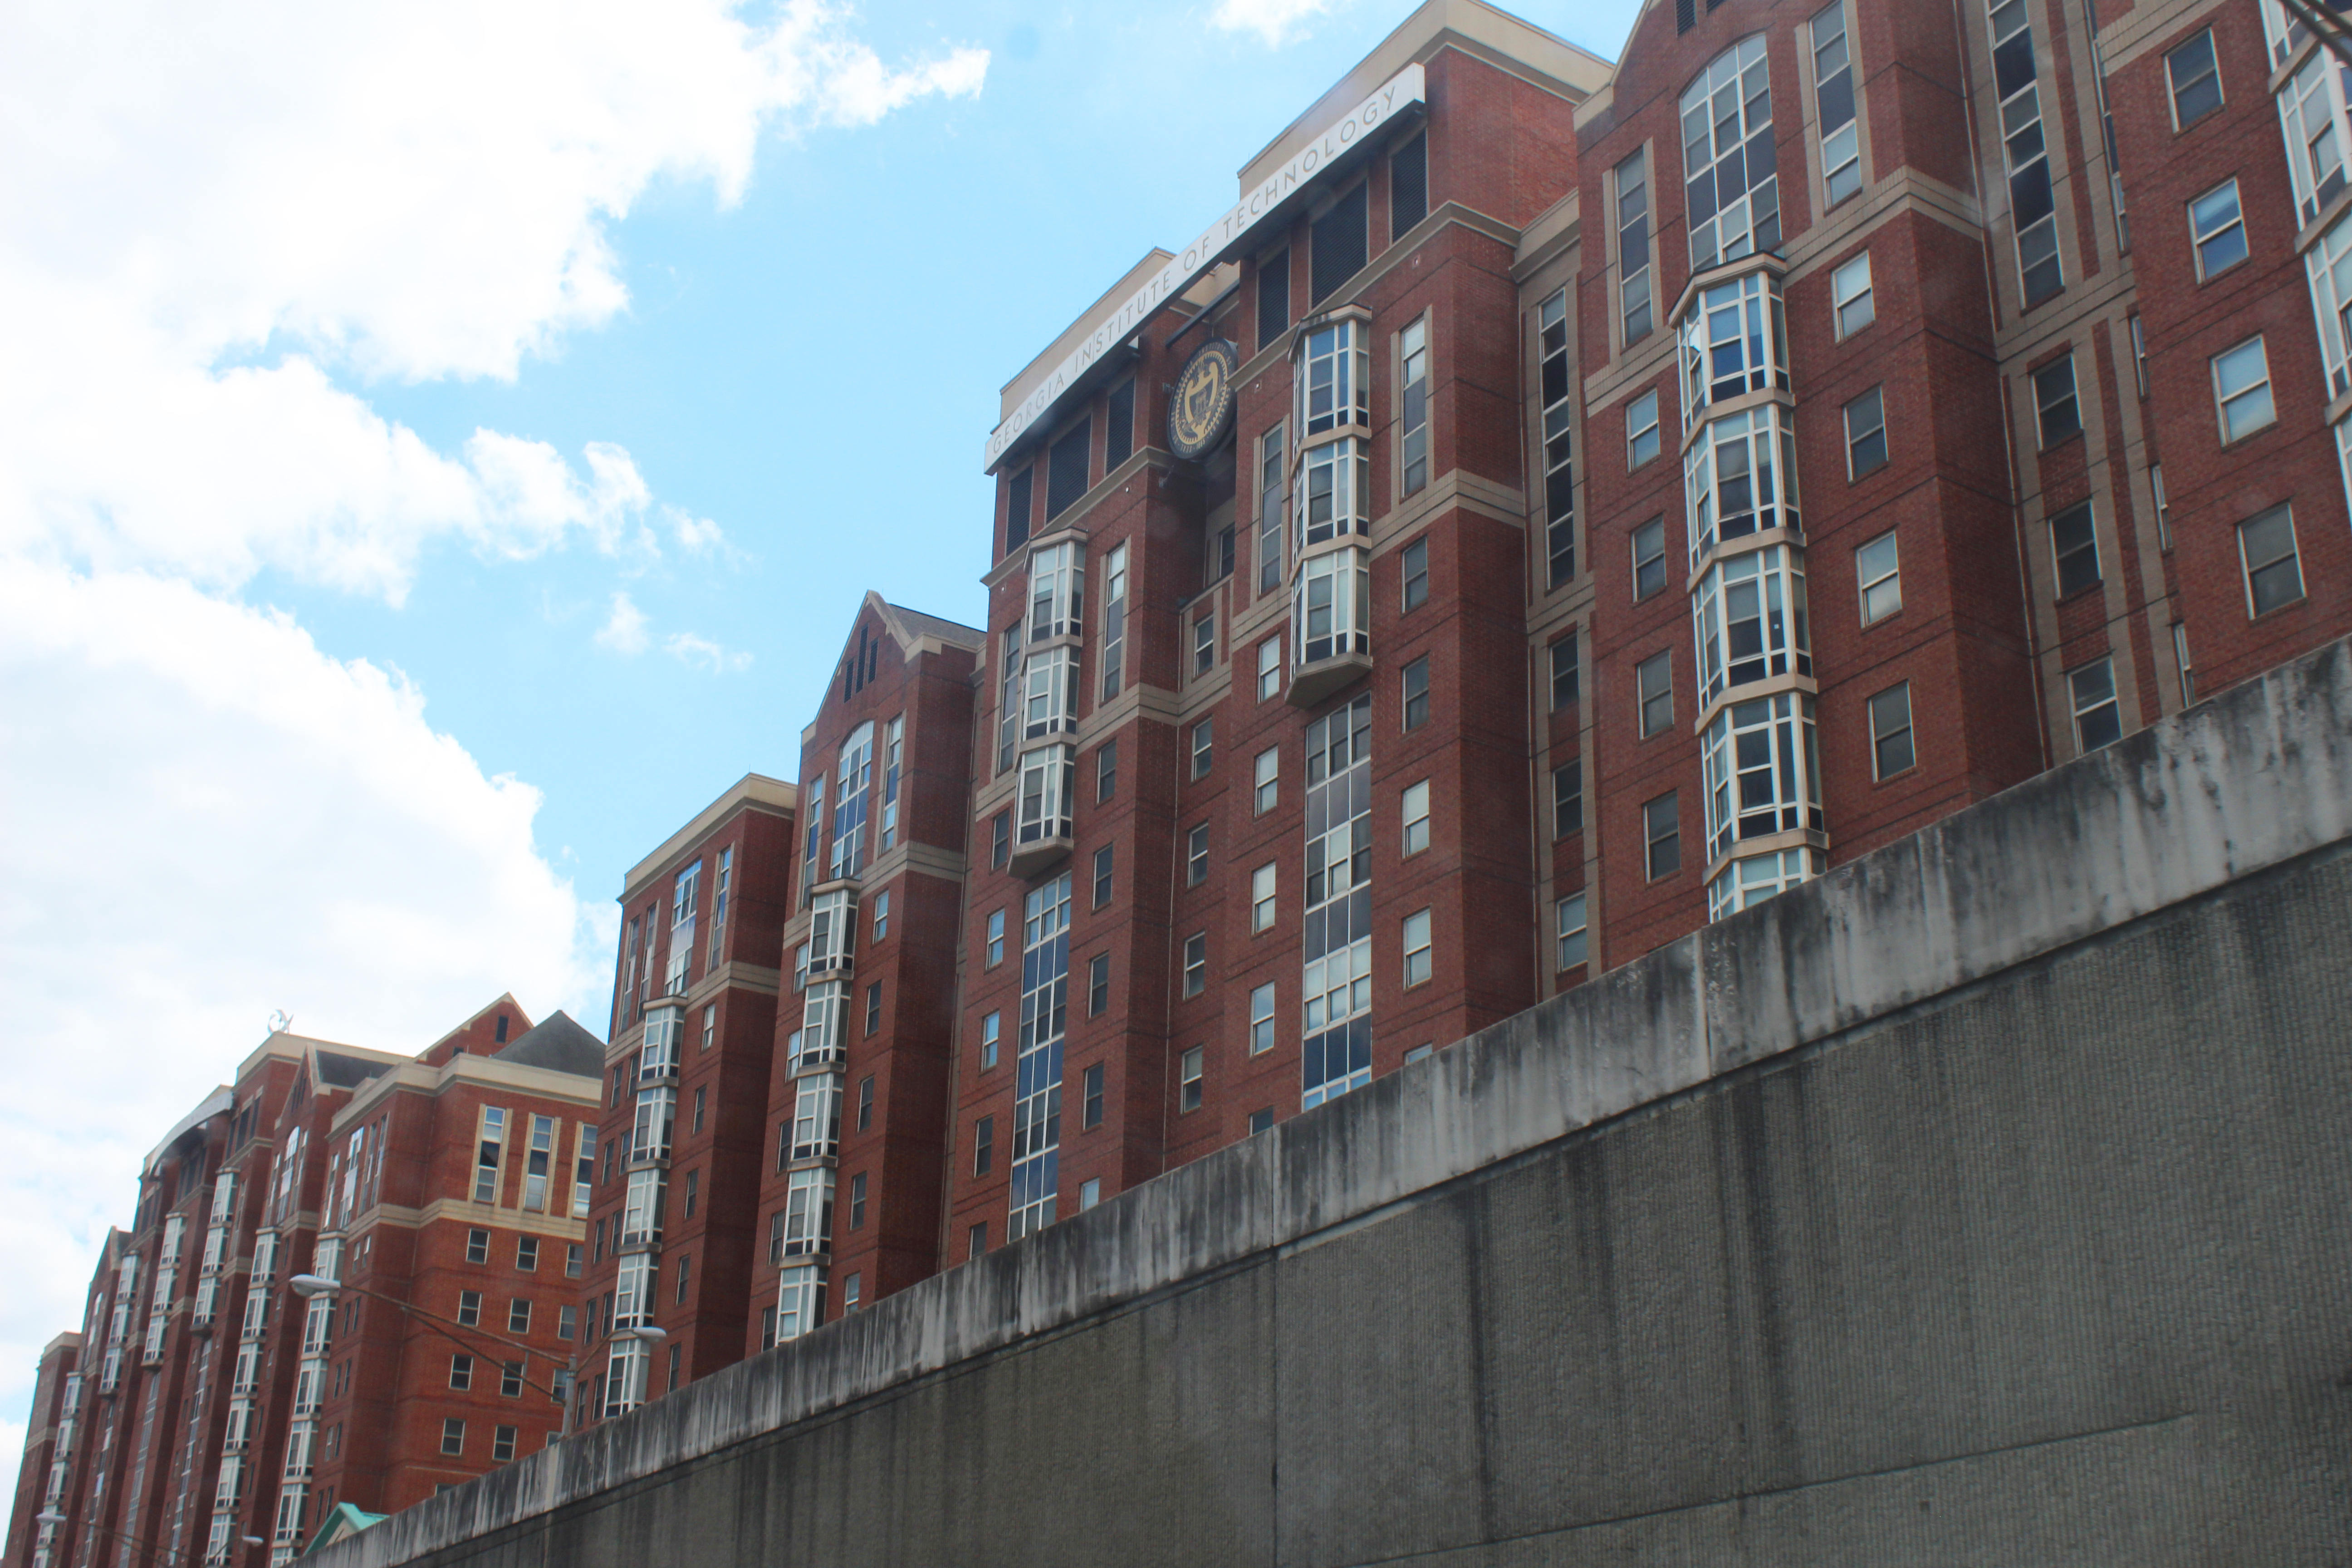
Social sustainability in Atlanta is boosted by many higher education and research institutions in the city, such as Emory, Georgia Tech, Georgia State University, and a few others. There are also smaller community-sized colleges in the city that offer a different approach to help current residents and attract potential residents to build a career (Department of Planning and Community Development, 2016). These large institutions help both experienced and budding professionals build a network and allow them to hone their expertise and unique skillsets for workforce development, job attainment, and career advancement. In return, it will boost the city’s already very well-established economic development. According to England (2017), economic development is very competitive and risky with entrepreneurial and is synonymous with city planning.
Another effort that the city has brought forth to improve social and economic sustainability is neighborhood stabilization and affordable housing Production. They fostered collaboration between the Atlanta Housing (AH) and the private-sector developers, acting as a catalyst to attract investment (Department of Planning and Community Development, 2016). Furthermore, other transit-oriented housing developments focus on establishing commercial corridors and neighborhood centers. Having a strong, diverse economic base can provide a range of businesses and employment opportunities that meet City residents’ needs. Continuation to revitalize Atlanta’s downtown because it serves as the city’s heart and soul will help ensure its major employers’ vitality (Department of Planning and Community Development, 2016). Economic development has become the strategy to improve the economic base and make the community more attractive to private investments. Urban planning is directed toward activities that support the economic development of communities (England, 2017).
Leadership in Energy and Environmental Design (LEED) is a national effort brought together by US Green Building Council to lower the impact that the building has on the environment, focusing on energy efficiency and self-sustainability in design (US Green Building Council, 2021). It also has more construction requirements, such as the source of building materials needs to be within a certain radius of the site. Many architects in the Atlanta government encouraged private developers to contribute to that effort, ensuring their design is LEED-certified, with different tiers of certification, silver, gold, and platinum (US Green Building Council, 2021). For example, the center of Greenbuild activity is the LEED Gold Georgia World Congress Center (GWCC) and the Mercedes-Benz Stadium, the new home of the Georgia Falcons, and the Expo Hall for conferences and events (Benjamin, 2019).
In 2017, the city council updated an ordinance to include requiring LEED certification for new construction. In 2018, Hartsfield-Jackson International Airport, the nation’s busiest, became the first airport in the world to be awarded precertification under the LEED for Communities program. In 2019, the city exceeded its energy goals in the Better Buildings Challenge by more than 20 percent (Benjamin, 2019).
Atlanta’s Non-Wealthy Communities and Past Successes or Future Plans Regarding Affordable Housing
As the largest housing authority in Georgia and among one of the most prominent in the nation, the Housing Authority of Atlanta provides and facilitates affordable housing resources for nearly 22,000 low-income households for almost a century. The city was the first to work on a federally funded public housing project in 1934, called Techwood Homes; it replaced what was known as a shanty town and opened for occupancy in August 1936 for low-income families, primarily for whites. The Housing Authority of the City of Atlanta, commonly known as AH, was formed the year after 1938 (Atlanta Housing, 2021).
The first black president of Morehouse College applied the Techwood Homes model to the planning of University Homes, a public housing project for black families on Beaver Slide slum (Atlanta Housing, 2021). He hoped to brighten the city’s most underserved communities to better the city overall as a whole and aid the Civil Rights Movement. The movement was initially very successful in desegregating the neighborhood, and black residents slowly integrated with the white neighborhood. However, the success was short-lived. The white families started to move out, and when the property was left with predominantly black residents, the racially motivated city administrators at the time purposely neglected the building. The building slowly evolved into slum-like conditions over time. Techwood later is demolished in preparation for the 1996 Olympics. The property, later acquired by Georgia Tech, was redeveloped for student housing (Atlanta Housing, 2021).
Since Techwood, there were a few other public housing projects created. However, by the year 2011, Atlanta would eventually demolish all the housing projects conceived from the 1930’s public housing. Replacing in their place would be mixed-income housing projects, and other federal US Department of Housing and Urban Development (HUD) based subsidized housing. However, HUD projects have a noticeably smaller impact as they were intended solely to provide vouchers to those with adequate needs and an ability to pay the remainder of living costs. Meanwhile, AH now operates and overlooks most of the mixed-income and senior living homes around the city of Atlanta.
Learning from the city’s past success and failure, AH vows to bring more public housing projects in modern ties. In FY 2019 alone, AH has served almost 25,000 households, provided over $5.5 million in monetary assistance, and created over 1,500 units (Atlanta Housing, 2021). According to the Department of Planning and Community Development (2016), the number of units permitted in Atlanta has increased steadily since 2010. There were 89,781 housing unit permits between 2000 and early 2016, almost 85% of which were in multi-unit structures. These types of units are attractive to one-person households as well as small households.
Furthermore, AH is also focus on green energy in housing. To reduce environmental footprints, AH focused on focus to AH-owned buildings to improve their “water conservation upgrades, weatherization, HVAC upgrades, lighting replacements, and natural gas boilers.” (Atlanta Housing, 2021) Following the Energy Star ratings, 6 out of 10 AH-owned buildings perform better than other public housing nationwide peers (Atlanta Housing, 2021).
The City of Atlanta announced its clean building ordinance in 2015; AH was the first to be compliant (Atlanta Housing, 2021). Each year, AH and many other entities voluntarily report our energy and water consumption to the city, intending to benchmark and lower these numbers (Atlanta Housing, 2021). Furthermore, in 2013, AH joined the US Department of Energy’s Better Buildings Challenge. They were tasked with reducing their portfolio-wide energy consumption by 20% within ten years, and they are on track to exceed that benchmark. At the end of FY 2021, they already reduced energy efficiency by 15%, equivalent to almost $4.7 million (Atlanta Housing, 2021). This AH acts as the catalyst for providing housing assistance to the city, and it also takes housing to the next level to incorporate green energy. AH’s effort and achievement serve as an inspiration and motivation for others to join the movement.
The City of Atlanta, Georgia, was founded in 1837. Its 2015, the population was an estimated 437,077 (Department of Planning and Community Development, 2016). Atlanta is a vibrant city and promotes sustainability, economic growth, and development. The city of Atlanta has set to ameliorate housing and transportation opportunities as one of the continuous goals to enhance its quality of life. The goal is to make communities better connected with ample opportunities to invest commercially.
The Atlanta Metropolitan Statistical Area (MSA), the center of a dynamic region, is the 9th largest in the United States (Department of Planning and Community Development, 2016). The city boasts the world’s busiest airport. It is the hub for several Fortune 500 companies, such as Coca-Cola, Delta, Turner Broadcasting, Porsche, and Equifax (Department of Planning and Community Development, 2016). Unfortunately, the City of Atlanta faces many housing challenges, ranging from affordability and cost-burdened households to high concentrations of poverty and abandoned properties.
With such a strong economy, certain counties in Atlanta, such as Fulton and Dekalb, have had rapid growth. A significant factor that reflects the population growth is the number and type of housing units constructed. According to the Department of Planning and Community Development (2016), the number of units permitted in Atlanta has increased steadily since 2010. There were 89,781 housing unit permits between 2000 and early 2016, almost 85% of which were in multi-unit structures. These types of units are attractive to one-person households as well as small households. However, figures and statistics have shown that the Atlanta housing market is where the median home value has declined while the median cost of rent increased. The Housing and Urban Development (HUD) defines cost-burdened households as those who pay over 30% of their income. Just over half of the city’s households are at or above this critical threshold (Department of Planning and Community Development, 2016).
Furthermore, Atlanta has had one of the highest income inequality rates for years. Piranim (2018) stated that Atlanta’s 2014 income gap is significantly higher than any American city. The city’s wealthiest 5% has an annual income of $280,000 or more, which is over a hundred times more than the bottom 20%, making $14,850 per year (Piranim, 2018). Comparing the map of median household income with the poverty rate in 2014, it is evident that a large concentration of households with a median income over $150,000 is in the north Fulton county, while the poverty rate is higher in the west and the south of the county (Department of Planning and Community Development, 2016). The overall poverty rate has increased since 2010; for example, the rate went up from 22.6% in 2010 to 25.2% in 2014, a value of around one in four people (Department of Planning and Community Development, 2016).
Many individuals work low-paying jobs in the hospitality and retail sector and spend more than half of their income on rent (Pirani, 2018). The issue of cost-burdened households has continued to be an area of focus for residents and the city’s housing providers, as evidenced in the City’s Housing Strategy and the Needs and Opportunities plan. Atlanta, the heart of civil rights, has come a long way from racial segregation, but it is currently in income segregation. A poor neighborhood is isolated by social class and a lack of transportation options. Children born poor are likely to stay in poverty from one generation to another (Piranim, 2018).
Aside from the housing issue, another downside to Atlanta’s economic development and population growth is the issue of traffic. I-285 is a highway famed for its congestion despite consisting of 12 wide lanes. The city is ranked 11th among the nation’s most congested cities, with drivers losing 108 hours to congestion; comparably, the national average is 97 hours (JLL Atlanta Research Team, 2019).
According to the Department of Planning and Community Development (2016), the city commute pattern in 2014 identifies 181,347 persons in the City of Atlanta labor force, 42% of whom lived in the city. An additional 12.9% worked elsewhere in Fulton County, excluding Atlanta, 14.1% worked in DeKalb County, and 19.1% worked in the other first-ring counties, such as Cobb, Gwinnett, and Clayton. The remaining 11.4% worked in outlying counties. There was a slight improvement when 54% of Atlanta workers commuted from outside of the city in 2002, compared to 58.4% in 2008. However, these numbers leave much room for improvement. Aside from environmental pollution, these statistics are concerning for two main reasons. First, metro Atlanta’s congestion is on the rise, with the region experiencing a 10% increase in hours lost year-over-year. Second, lost hours equates to lost dollars, as shown in 2018, when congestion costs in metro Atlanta exceeded $1,500 per driver, or over $3.5 billion when aggregated for the region (JLL Atlanta Research Team, 2019).
Problems in the City of Atlanta: Solutions, Reasonings, and Implementations
JLL Atlanta Research Team (2019) stated that “sustained, robust regional growth spurred by a business-friendly environment and relatively low cost of living, has made the region a victim of its own success.”
Problem 1: Affordable Housing
The city has concentrated areas of poverty that need to be addressed. The poverty rate has increased since 2010. As a result, Atlanta needs a diverse and balanced housing stock that provides affordable housing, options to meet the needs at each stage of life, a range of incomes and economic situations, and proximity to jobs and services. There is an insufficient supply of affordable housing to meet the needs of middle and low-income households. Existing affordable housing units are being replaced by market-rate units that are unaffordable to middle and low-income households. I anticipate that a challenge to creating a balanced housing stock is the potential cost of creating it. I propose that it need to be subsidized somehow using governmental funding, and I can identify a tax or a fee that could be used to do this.
Problem 2: Transportation
Atlanta is notorious for its traffic congestion on the highways and the lack of parking space. Building more highway lanes did not help but instead worsened traffic. New residents take to the road for work or school; regional transportation infrastructure cannot handle the influx of growth, and the roads experience strain. The city needs to devise and encourage more public transportation to the mix to deescalate traffic congestion.
These two problems mentioned above correlate with each other, where one is the cause that can affect others and vice versa. Proper development of a housing plan, especially near a commercial area or transportation station, can reduce the need for a commute. Likewise, a collaborative transportation organization can reduce congestion and connect the neighborhood segregated by social class, thus improving the development and utilization of mixed-income housing.
Solution A to Problem 1: Redevelopment
Atlanta needs to create a more sustainable redevelopment project. An excellent example from the past is the Livable Centers Initiative (LCI) plan; it focused on transit-oriented development in the city’s planning efforts. According to the Department of Planning and Community Development (2016), the agency, Atlanta BeltLine, Inc., connected 45 in town neighborhoods via a 22-mile of repurposed old railroad tracks that encircled the city. The plan was created to implement the vision of housing equitably and meet the Atlanta City Council’s goal of creating or preserving 5,600 affordable housing units within the BeltLine Tax Allocation District (TAD). I agree that the BeltLine is an example of how the city has solved a potential redevelopment problem. This redevelopment line and revitalization have been proven to work and can be utilized for other areas within the city.
Solution B to Problem 1: Public-Private Collaboration
The City Council has signed contracts with private developers on projects like LCI, but they should incentivize private developers to bring adaptive reuse of dilapidated buildings. In my hometown in Augusta, the city has incentivized new development for its historic downtown. When my aunt and uncle were planning on opening a restaurant, the city offered a grant to open a restaurant in the dilapidated downtown areas. Atlanta, likewise, should incentivize developers to build on projects that developers assume might not bring a significant return on investments. While most private entities only care about their financial bottom line, the city council needs to educate the private sector on the humanitarian impact of providing equitable housing for many people. Furthermore, I would help developers in their financial considerations before taking on risks doing projects such as these.
The legislation should also steer private developers to ensure that areas around the BeltLine remain affordable and accessible to all of Atlanta’s residents or create a program that motivates residents through tax reduction. To illustrate, the Neighborhood Stabilization and Affordable Housing Production fostered collaboration between the Atlanta Housing Authority (AHA) and the private sector, develops housing that supports neighborhood stabilization, acting as a catalyst to attract investment (Department of Planning and Community Development, 2016). AHA strategized a Choice Neighborhoods Implementation Grant, which provided $30M in public and private funding to revitalize an existing public housing site and the surrounding neighborhoods in Ashview Heights, Atlanta University Center Neighborhood, and Vine City. As an added benefit, AHA’s investments and commitments also preserve and protect the long-term availability of affordable housing in Atlanta.
Similarly, I identified a neighborhood in the Midwest of Atlanta called “Blandtown,” which potential for redevelopment as the poverty rate in this area is high. Aside from the Beltline’s redevelopments, a mostly undeveloped area within walking distance would be perfect for this project’s location. Based on my early investigations, it appears that this property is owned by a single owner but is zoned for multi-family. The city planners could design around a mixed-income plan and have it work at the local scale. Public communal spaces should available in between and along the way from residential spaces.
Encouraging housing developments that focus on proximity living also reduces the traffic commute time. Proposal A and B for Problem 1 also directly influence public transit, given the proximity of the site to the Beltline and other public transit such as buses. These proposals have the potential to bring benefits to the traffic problem that Atlanta faces as well.
Solution A to Problem II:Expand Public Transit
After years of experience visiting Atlanta and talking to friends and relatives who live in the area, Atlanta public transit is not being utilized as much because it is not expansive enough to get people to the places they need to be. Atlanta City Council should increase funding for Metropolitan Atlanta Rapid Transit Authority (MARTA) with increased transit access within city limits. The city should develop a balanced, multi-modal transportation system that provides choices for local and regional trips. A proper investment in transportation infrastructure should promote economic development in the regions that it connects. Furthermore, the city should incorporate any suggested changes to existing transit services, facilities, and projects to provide a coordinated region-wide approach and enhance riders’ connectivity. Finally, the plan managers need to create performance measures, monitor public transit usage, and be adaptive to the population’s changes in needs (England, Pelissero, & Morgan, 2017).
Solution B to Problem II: Expand Commute that Does Not Require Automobiles
I would make downtown Atlanta a more bikeable, walkable, and pedestrian-oriented community offering various safe and affordable transportation options, such as sidewalks, streetscapes, greenway trails, bike lanes, and handicap accessibility. As recommended by Atlanta City Council (2013), I would also maintain existing pedestrian and bike facilities and propose future streetcar infrastructure to improve connectivity by creating new streets.
National best practices call for equitable and affordable transit-oriented development to be within one-half mile of public transit. To ensure that the Atlanta BeltLine trails, transit, and parks remain accessible to neighbors within walking distance, affordable housing must be available within the Tax Allocation District. The area is measured from a one-half mile on either side of the BeltLine corridor (Atlanta City Council, 2013). I deduce that people will be more likely to use bike and walking paths instead of using a car if the city makes things easier to get to via these methods.
Reasoning of Solutions for the Affordable Housing Problem
The creation of LCI and other transit-oriented developments improved housing by focusing on redevelopment of the commercial corridors and neighborhood centers. Having a strong, diverse economic base can provide a range of businesses and employment opportunities that meet City residents’ needs. Continuation to revitalize Atlanta’s downtown because it serves as the city’s heart and soul will help ensure its major employers’ vitality.
I would foster more win-win situations like LCI promoting residential development at new and existing transit stations, which will stimulate mixed-income residential, job creation, and economic development. Deconcentration and segregation of the city can create a chain of issues that turn into social conditions wherein the crime rate increases as dilapidated properties are abandoned and schools become under-resourced (England, Pelissero, & Morgan, 2017).
Reasoning for Expanding Public Transit
Streetcars, arterial bus rapid transit, and enhanced bus service will expand transit options, attract more riders and reduce single-occupant vehicle use (Atlanta City Council, 2013). The large-scale public transportation enhancements and expansions slated for implementation will impact Atlanta’s built environment and change the way people and goods move throughout the region (JLL Atlanta Research Team, 2019). I foresee a positive impact on commercial real estate as well as residential properties. In the near-term, it means temporary disruptions to existing infrastructure as systems are enhanced or developed that during construction may dampen a property’s attractiveness. These improvements will also have a long-term impact as the enhancements and expansions will increase the quality of life, reduce lost revenue due to congestion, and, most importantly, provide better access between people and the workforce (JLL Atlanta Research Team, 2019).
Reasoning for Expanding Alternative Methods of Commute
England (2017) stated that a way to hold down cost is by turning to alternative resources. Bicycle and pedestrian facility planning, construction, and maintenance are cost-effective investments alternative to fixing the city’s infrastructure or expanding transportation choices. They also have low emissions, thus producing less strain on our environment and improving the quality of life overall in the city.
Implementation of Solutions for Affordable Housing
To revitalize the city center, the Council needs to implement measures to identify abandoned structures that accumulate over the years. HUD in the Department of Planning and Community Development (2016) promotes the development of affordable workforce housing and community development policies and fiscal oversight and management of state and federal development contracts and programs valued more than 30 million dollars.
Atlanta’s remediation strategy should focus on duplicating projects similar to the one at the Ford Factory Loft on 699 Ponce de Leon Avenue. In 2016, I visited Atlanta to see a friend who lived in the loft, formerly the Ford Motor Company’s headquarters from the early to mid-1900s. The factory was sold for development in the late 70s and became an apartment complex. Before entering the building, I saw retail shops occupied the first floor. After going into the main gate, I entered the lobby with resident mailboxes and numerous bike racks. Then, I saw an open atrium where many residents gathered to socialize in the center of the complex, which was lit with ample sunlight instead of electricity. These amenities, such as bike racks and shops, are simple moves that can add value to any housing project and convince potential residents to move in, and that I embolden any housing project to be required to include these.
Implementation of Solutions for Transportation
To bring about an implementation, England (2017) mentions that managers often allocate budgets equally across a city’s political units under developmental and redistributive policies. In 2016, the City of Atlanta voted to enhance and expand those services even further via a half-penny local sales tax forecast to fund $2.7 billion in improvements.
After funding and resources are secured, I recommend that the Council consider prior research as a model for implementation and conduct a service survey for the bus, rail riders that MARTA moves 7.9 million throughout Fulton, DeKalb, and Clayton counties (JLL Atlanta Research Team, 2019). A great example of a bike and pedestrian plan is stated in the city’s comprehensive plan from 2016. The Cycle Atlanta: Phase 1.0 Study corridors connect to all of the MARTA stations within the Atlanta BeltLine loop and the Atlanta Streetcar. The corridors connect directly with 12 of the 24 MARTA stations in the City of Atlanta (Department of Planning and Community Development, 2016).
1. In his interview, Gen Petraeus discusses four tasks of a strategic leader. What are these tasks? How would you apply these tasks to an organization (government or nonprofit or private) you are currently working for or worked for in the past?
Petraeus shared four critical tasks of strategic leadership (Harvard Belfer Center, 2016). First, leaders need to ask for their targeted audience’s needs and then develop a pathway and strategies to succeed. Second, leaders must communicate their goals in a variety of ways within the organization. Third, with the goals set in place and promulgated, they must carefully monitor the implementation process. Last but not least, they need to evaluate whether a strategy needs to be revised or replaced. The four steps then repeat until the organization achieves mutual satisfaction among itself or its targeted audience (Harvard Belfer Center, 2016).
While I have never been in a leadership position authoritative enough to implement strategies, I have seen strategic leadership in action at Augusta University, just like Petraeus has discussed. Amid a deadly pandemic, the AU Office of the Provost worked around the clock with the Deans and Department Chairs of each college to listen and understand their needs, all while obeying general guidelines from the University System of Georgia. Then, the leaders developed many strategic plans with the Office of Facilities Operations, including but not limited to, establishing the new capacity of every classroom on campus and installing hand sanitizer stations. Third, the Provost team worked with the Division of Marketing and Communications and the Division of Enrollment and Student Affairs to broadcast the campus reopening plan. There were numerous email blasts, social media posts, website updates, phone calls, and even local news channels to inform everyone in the institution about the new guidelines and plans. Last, the leadership team continued to meet and evaluate their performance by live streaming town hall meetings to keep everyone updated. There were also many quality surveys sent out to students and employees for their feedback on campus safety and social climate. I was in awe to see the assiduous work that our leaders have performed, and it truly inspired me to see what explementary leadership can do to bring peace and success to an organization.
2. What are some limitations of expert power?
According to Yukl and Gardiner (2020), when an individual in an organization has much more relevant expertise in the specific task or career in demand, the effects of expert power will be automatic to the organization. For example, in the US, a team of infectious disease experts recommends a form of COVID-19 prevention, and politicians adapt by creating policies that would favor those recommendations.
However, the limitation of expert power is that the organization is under the condition that others are dependent on the expert for advice but do not have such an obvious advantage in expertise on their own (Yukl & Gardiner, 2020). While the person with expert power must provide information, they must also help others outside of the expertise to comprehend. It is helpful to provide elementary reasoning and conductive explanation. Most importantly, it will have to be in line with the overall organization’s interest. Bernard (1938) said that a person accepts a communication as authoritative under the first and most important that he or she understands the communication. Second, when receiving the communication, he or she believes it to be compatible with his or her interest or the organization as a whole. In the US, for example, wearing a mask is recommended by the experts as it is proven to slow the spread of COVID-19, but governors from each state have different opinions and have made different policies.
Another limitation is that the person with expertise is perceived as the leader to be a reliable source of information and advice (Yukl & Gardiner, 2020). Even if expertise is evident with a diploma or license, perception is equally as important as the real expertise. The individual with expert power who has the credentials to prove this skill must also take time to build more comfortable trust from others. The expert knowledge is put to the test over time, and the others validate the expert power. Thus, it is important to know that time is a limitation, as leaders need to develop and maintain a reputation for strong expertise and credibility. In the US today, we can see that experts from the Center for Disease Control have the credentials for their work; however, the relationship between them and our politicians is fractured after time. It is evident that through this fractured relationship, the politicians have discredited the expert’s recommendations.
3. How does organizational culture influence perceptions of ethical behavior?
According to Bernard (1938), organizational culture is impersonal and not directly stated by the organization chart as this type of organization derives from the relationship among its members. Menzel (2017) stated that cooperation in the relationship is conscious, deliberate, purposeful. Culture has much to offer in leading and building an organization of integrity. It can be a subset of ethical culture as both share values that constitute the overall organization of the company (Menzel, 2017). Leaders understand and apply cultural norms in forming relationships and rapport with others in the company. They tend to contribute to the effectiveness and sustainability of the organization’s integrity. A culture perspective is the most promising organizational perspective to consider when devising a successful ethics management strategy.
Out of all the companies that I worked for since obtaining my undergraduate degree, AU has the most eminence of cultural influence over ethical behaviors. AU has accepted many students and hired employees worldwide who brought their cultural values to campus. Their culture gave them strong but different political reactions regarding protests have spurred nationwide due to several deaths related to police brutality, which gained steam over social media. Reflecting on a diverse campus and institutional values, AU has chosen to welcome the voices from different ethnic student and employee populations instead of oppressing them. For example, the Office of Diversity and Inclusion (ODI) partnered with the Multicultural Student Engagement (MSE) to host reoccurring virtual listening sessions. They invited the Provost and senior leadership to listen and directly interact with students, faculty, and staff regarding disparity and inequities on campus.
4. How can we build ethical organizations?
To build an ethical organization, we must continuously pursuit ethical competence. I believe that everyone in an organization shares an equal part in building ethics. Still, the leaders are responsible for advocating, coaching, correcting ethical behaviors, and documenting any incidences. If the leadership, especially in the public sector, does not provide adequate coaching or corrections, external outlets will do it for them. When it gets to that point, it will already be an embarrassment for the organization. Menzel (2017) mentioned the term ethics watchdogs, the news media whose mission is to keep track of unethical or suspicious behaviors.
To put the ethical competencies in action, Menzel (2017) identifies five steps in a repeated cycle. The organization’s leader must have (1) the ability to commit to ethical standards, (2) knowledge of the code of ethics, (3) engage in principle moral reasoning, (4) act on public values, and (5) promote ethical practices in the organization. These repeated steps form dynamic energy for competence. Unfortunately, most of the companies I worked with established the impression that ethics management is solely the responsibility of the Human Resources Department of an organization through the employee handbook. After I finish an onboarding process with a company, the ethics organization was never brought up again. The only apparent way a company maintains ethics organization was to reprimand or terminate an employee over reported incidents. Nevertheless, the leadership from my current employer, AU, has given me a clear view of Menzel’s steps of ethical competence in action and what ethical organization is in real life.
First, AU promulgates a clear commitment to ethical standards as it is listed as a part of its mission. Second, AU hired several authoritative leaderships in ODI and MSE. These new hires brought their expertise that the institution can utilize to achieve a greater goal. Third, the institutional leadership team offers to listen to concerns from students, faculty, staff, especially the minority group. They are also conducting a study to determine the best course of action to address the concerns. For example, MSE issued a Diversity Climate Survey to all students, part of a bigger goal to complete social research. Fourth, collaborative efforts can also be seen in ODI that is responsible for providing grants on research for subjects such as health and education disparities. They also provide proper training on sensitivity, along with many other ethical subjects. Fifth, AU continues to publicize itself firmly as an institution committed to equity and diversity. The Provost team regularly speaks about the institution’s mission for diversity and inclusion at every commencement, new student orientation, and town hall meeting. I must admit that there is no other company that I worked for really focus on building an ethical organization in a way even remotely similar to AU.
References
Bernard, C. (1938). The Functions of the Executive. Harvard University Press.
Harvard Belfer Center. (2016, April 8). David Petraeus: Four Tasks of a Strategic Leader [Video file]. Retrieved from https://youtu.be/Ej4SmxDfEgQ
Menzel, D. (2017). Ethics Management for Public and Nonprofit Managers, Leading and Building Organizations of Integrity (3rd ed.). Routledge, an imprint of the Taylor & Francis Group.
Yukl, G & Gardner, W. (2020). Leadership in Organizations (9th ed.). Pearson Education, Inc.
What are some ways to become a flexible and adaptive leader? In the short term? In the long run? Explain using examples.
Leaders must understand and become aware of their situation and environment, which will help them identify constraints and demands to make it more favorable toward their goals, according to Yukl and Gardner (2020).
The first step for leaders to be adaptive and flexible is to provide more direction to subordinates with interdependent roles. For example, a leader needs to establish a stable organization chart and must ensure that each member is coordinated. A short-term goal is to plan and anticipate any critical tasks and prepare the tasks for them. Examples include providing a clear objective to the subordinates and monitoring those who are liable for the task. When less time is available to provide support, encouragement, and recognition to individual subordinates upfront (Goodstadt & Kipnis, 1970), more problems will arise with subordinates being handled in a more impersonal manner. This creates a situation where they are likely to receive warnings and punishment after the task or have a performance problem (Kipnis & Cosentino, 1969).
Long term ways for leaders to adapt are to provide more instruction and coaching to an inexperienced subordinate. Yukl and Gardner (2020) suggested that leaders need to discover the weakness of their subordinates and build on them instead of disparaging them. For example, leaders need to be more supportive of someone with a highly stressful task or newcomers acclimating to the organization. Sources of stress may include unreasonable demands (e.g., abusive customers), an uncontrollable environment (e.g., natural disasters, pandemic, and social unrest). People in such situations have more need for emotional support from leaders and coworkers. If people are working with the backing through stressful times, they are likely to succeed and, in the long term, will build collegiality with other teammates.
Think about a manager/coach you have had an opportunity to observe. What specific tasks related and relationship-related behaviors did this leader use, and how effective did the leader appear to be?
According to Yukl and Gardner (2020), task-orientated behavior is focused on accomplishing tasks efficiently while relations-oriented behavior forces on building trust, cooperation, and just satisfaction. Due to unfortunate circumstances, I have had seven different jobs since graduating from college in 2013. However, it was through working in these companies that I observed different managers and experienced different work cultures.
While most of the managers that I work with are very much tasks-focused, there are a few managers that focus on both tasks and relationships, which I found very impressive, and watching them leading as an example makes me want to work just as hard as them. My supervisor at the College of Nursing, while very stern and detail-oriented, always worked on building rapport. While I frequently found the amount of attention to detail insufferable (e.g., mandating “hello” in email greetings instead of “hi”), she adequately provided a pathway for me to reach her level of expectation. One of the many examples includes approving funding for me to take technical courses from Augusta University Continuing Education. She also had a keen observation skill, and once she realized what my strengths and weaknesses were, she adjusted the tasks appropriate to my skill. She looked out for tasks that involve creativity, such as designing flyers and photographing for events for Staff Council and would cordially approve my travel request and time adjustment, so I can make it to those events and let my creativity shine.
However, I have had a destructive leader who was incredibly task-focused, so much so that he sacrificed the working relationship with his team. My short-time boss at Savannah River Site (SRS) wanted to get things done and often time trampled through lawful procedures and omitted approvals from the upper executives. He often got impatient because SRS has always been known for its complicated bureaucracy and red tape. He would request me to order things without consulting with the procedure. As a newcomer who was not acclimated to the SRS bureaucracy, I unwittingly followed his directions.
The goals he accomplished ended up causing problems down the road. The first order of merchandise had to be canceled because it was sent without the approval of a contract. It resulted in wasted time for our vendor and legal issues as the SRS is funded by taxpayer money. The second time we ordered large banners but without consulting the design with upper executives first. We ended up receiving complaints about the design, and we had to take them down, which resulted in wasted funding and storage space. While I got along with my boss well because I follow his instructions as he stated, other members of the team did not follow because of their pre-existing understanding of the procedures. He would become reactive and got into heated arguments, and before long, he was out of SRS. I had to learn all the procedures correctly, and I realized what a devastating impact that my actions, under an oppressive leader, have caused for the company.
Think about your current or previous experience as a member of a work or social group. How much influence do you prefer over decisions made by the leader? Does it depend upon the task? What are the reasons for your preference? (Hint: think about issues of delegation and empowerment)
I have worked for both private and public companies and have seen the good, bad, and the ugly. One of the ugly side that I have seen is through a private company’s tyranny of nepotism. My distaste for nepotism grew ever stronger in the wake of recent social movement where privilege is identified, and the impact that nepotism has on other people’s chances for success is devastating. For that reason, I do not think leaders should have much power in the decision itself, especially hiring or firing of an employee. Instead, leaders should focus on their power to empower others to participate in making decisions, but not the decision itself. That will help the decision to be made with consideration from a different perspective and will increase the chances that the decision will most likely benefit everyone.
Even if the decision is for a different task, I often feel the decision is best by a group instead of the leader itself. It gives chances for everyone to voice their thoughts, which will help nurture further leadership and empowerment. However, I also believe leaders should be able to make objections or recommendations to the associates based on real-life experiences. At the same time, I think leaders should continue to be willing to learn and listen to criticism regardless of how many years of experience they have. Leaders are best when they can respect the old tradition but bring new ideas to harmony, especially in such an ever-changing market and social environment.
I learned the downside of shared decision power through my people management experience in student organizations. Through those experiences, I learned to delegate and to provide guidance and support for my teammates. Many times, I observed that other officers often talk about big plans and use the meeting opportunity to shine, but after the meeting, they often forget their tasks or duties. My leadership role at that point is more critical through support and reminders instead of doing the task for myself. I cannot lead if I cannot go through the footsteps of my followers. I often go through with the steps of the associate officers in their shoes. The most influential leader, which, in my opinion, is proven through my many years of working experience, are leaders who lead by example and who are adaptive and open to learning or criticism.
While a leader could easily make all the decisions and do everything on their own, they might not be able to handle customer relations or suppliers or the underlying reasons for underperformance. There are times when the leaders need to step up and make decisions in case of emergencies. Still, the general rule of thumb should be that the more significant influence that the leaders have in the decision, the more they should be ready to accept all the responsibility and any consequences that follow.
Why do you think it is very difficult to measure leadership effectiveness?
According to Yukl and Gardner (2020), large numbers of studies on leadership behaviors have been reviewed and analyzed; however, the interpretations often are inconclusive. Many research methods for analyzing research are performed through a qualitative approach, such as interviews, surveys, etc. The evaluation or measurement of a leader’s effectiveness can be subjective. A leader’s behaviors do not necessarily link to a subordinate’s job satisfaction.
Also, while Yukl and Gardner (2020) stated that some studies have linked leadership effectiveness with an objective measure, such as sales goal, profit margins, leadership is only a small cog in the bigger machine of operating a company. Those types of standards are strongly impacted by the surrounding economy, market trends, and public policy. Effectiveness through those measures also has a critical flaw, which is that leaders often perform not based on their personal preference but on the company’s culture or rule. As a result, the effect that is being measured is not about a leader but the company’s policy.
Last but not least, another underlying reason why measuring leadership effectiveness is difficult is individual perception and attitude (Yukl & Gardner, 2020). Even the subordinates’ private life could impact how they interact or feel about someone’s leadership. There are unpredictable factors that make it incredibly difficult for a study to be statistically proven or to identify the correlation between variables. Employees’ response towards a leadership has other influences other than the leadership itself. I have often seen political preference impact the working relationship at SRS. Bias is usually affiliated with each political party. That bias can create a negative impression or an unreasonably positive one without having any relation to the person’s skill or working capability.
I believe that leaders and their leadership are at the mercy of others. This includes their subordinates, the company as a whole, the third-party vendors, customers, partners or affiliates, the market, or the social climate. Leaders play an essential role as they are the connecting points between all these factors, and every leader’s leadership style could vary a little based on their personal preference. A leader’s evaluation should never only be studied from their subordinate’s point of view because of the divergent tendency of their role.
References
Goodstadt, B. E., & Kipnis, D. (1970). Situational influences on the use of power. Journal of Applied Psychology, 54, 201–207. https://doi.org/10.1037/h0029265
Kipnis, D., & Cosentino, J. (1969). Use of leadership powers in industry. Journal of Applied Psychology, 53, 460–466. https://doi.org/10.1037/h0028668
Yukl, G & Gardner, W. (2020). Leadership in Organizations (9th ed.). Pearson Education, Inc.
This position paper summarizes the key takeaways from the selected reading and connects them with my life experiences. This paper will show how the context of Green and Haines’s (2016) book, along with other scholarly articles, connects the various ways with the community that I currently live in Augusta, GA, and Taiwan, where I was born and raised. I will apply the contextual theories and terms to real-life examples from my life in order to evaluate and analyze any success or room for improvement for community development.
While natural disasters rarely devastate an entire country, their effects are localized and will have an immediate impact in smaller regions (Green & Haines, 2016). In community development, it is common to mitigate the natural hazard, a probability, or potential for damage by natural disasters. Once the risk is identified, developers and policymakers must cope with it by adapting and a focus on minimizing negative impact while optimizing the positive. The US should be the most focused on adapting to climate change as it was the largest emitter of greenhouse gas in 2000. While the US has a very organized emergency response team through FEMA and large non-profits like American Redcross as identified by Green and Haines (2016), the US lacks in prevention and much needed effort is desired.
As a nation, Taiwan has adapted recycling as a way of life, in schools, work, and residential homes. Waste pick up services and recycling is calculated within the municipal taxes. When I immigrated to Augusta, Ga, in 2006, I realized that recycling and conservation were more of a mellow, optional subject that one could learn more about from non-profits, such as the Phinizy Swamp and not an obligatory subject in the school or mandate from local government. What was more shocking to me is that not only are recycling companies privatized, but some waste services are also. In Columbia County, neighboring to Augusta-Richmond County, waste services are not part of property taxes, and thus landlords and homeowners have to make contractual obligations with private companies.
Community development faces challenges when services are privatized, as for-profit companies do not have the same bottom-line. Environmental capital is an essential aspect for a community to have strong sustainability, which means it must store resources to higher levels rather than maintain them at the same rate for future generations (Green & Haines, 2016). The City of Augusta and many parts of the US are lacking behind in environmental conservation.
Human Captial: Healthcare Challenge
To understand what factors correlate with health disparities, Brulle and Pellow (2006) focus on the need to integrate environmental inequality and its health impacts. They concluded that in order to prevent environmentally related health problems and address environmental inequality, an understanding of how social and environmental factors influence health is necessary (Brulle & Pellow, 2006). With a lack of environmental protection, communities that are inundated are already at risk for health issues from pollution; having limited healthcare makes it even worse. “Although the United States spends more money per capita on health care than does any other nation in the world, the overall health of the population lags behind that of most industrialized countries largely because of persistent and growing disparities in mortality, morbidity, and disability between socioeconomic statuses” (Brulle & Pellow, 2006, p. 103).
Taiwan has established national healthcare for all its citizens, similar to other industrialized countries. While the Affordable Care Act made a historic debut in the US, it only provided coverage for a fraction of its citizens. There are four hospitals within a ten-mile radius of downtown Augusta: University, VA, AU Medical Center, and Trinity. I am confident to say that there are more than adequate healthcare resources in this city. However, accessibility to these resources can differ based on employment and income as statistically proven in many cities of the US.
Nevertheless, such a disadvantage in Augusta is overcome by its local institutions of health sciences. Low-income residents of Augusta benefit from the low-cost services from the Dental College of Georgia, College of Allied Health Sciences, and College of Nursing. Operated by faculty and students, “Associacion Latina de Servicios del CSRA” served many Hispanic migrant workers who do not have access to private health insurance. Also, other non-profit organizations in the area include Safehome of Augusta, which provides shelter and counseling for domestic violence victims, and many religious organizations, such as Catholic Social Services, that provide families in crisis with essential needs and faith-based healing. They also frequently partner with local homeless shelters as well.
Public participation efforts in community planning processes are crucial (English, Peretz, & Manderschied, 2004), but without healthy citizens, a community will not have adequate human and social capital. In the US, the economy thrives with privatization and capitalism, which negatively affects poverty, inequity, and underprovision for public goods, such as healthcare (Fung & Wright, 2001). While Augusta outperformed other cities regarding its accessibility and resources to healthcare, it is nowhere near the level of Taiwan, where healthcare is equally distributed among its citizens regardless of socioeconomic status. Unfortunately, it would be hard for Augusta to improve accessibility issues due to the capitalist approach to healthcare in the US as a country.
Thriving Cultural and Creative Capitals
Even though I have been critical and harsh on Augusta regarding its challenges with the environment and healthcare, I want to commend the city for its thriving creative and cultural capitals. Sen believes culture as a constitutive part of development that brings the enrichment of people’s quality of lives “through literature, music, fine arts, and other forms of cultural expression and practice” (2004, p. 39). Sen also states that cultural activities are remunerative depending on the hosting organization, facilities, and the community’s environment. While the purpose of cultural or religious sites is focused on monetization, the linkage of tourism revenue with the cultural and historical sites is evident. The Creative Class brings specialized skills in music, dancing, and other cultural activities that bring identity to the hosting community (Green & Haines, 2016). In addition, these activities help to attract people to particular countries or regions, promoting growth in population in a community (Sen, 2004).
As a board member of the Chinese Consolidated Benevolent Association, I have seen the effort that we go through to carry out our mission to provide fellowship to our members and promote public awareness of Chinese culture and heritage. We collaborated with other non-profits, such as AU’s Chinese Student and Scholar Association and Confuscious Institute, the Goodwill Industries of Middle Georgia and the CSRA and the Greater Augusta Arts Council. We participated in the area’s notable cultural events, such as the Dragonboat Festival, Moon Festival, and Arts in the Hearts. We performed traditional dances, eastern instruments, and served traditional cuisine.
Besides economic benefits, Sen (2004) identifies that even the operation of social solidarity and mutual support can be strongly influenced by culture. We served an educational purpose for many years. We partner with the Richmond County Library, Lucy Craft Laney Museum of Black History, to contribute information to the Augusta Riot in 1970, a result of racial injustice under the eyes of the law. The Chinese had a humble start in Augusta when they arrived as laborers to enlarge the Augusta Canal in the late 1800s. The population of Chinese people in the area prevailed through the bleak period of segregation and racial unrest, which resulted in the loss of many Chinese-owned grocers in the 1970 riot. They were able to sustain through a strong bond and formation of values in the community. This, in turn, is influential in the identification of the community as a whole.
Taiwan does not have a substantial cultural and creative capital as compared to the City of Augusta. It is understandably due to the difference in foreign immigration volume compared to the US for many years. The city also has a unique way of promoting the love of culture outside of typical museums, such as those in Taiwan, or social enclaves, like Chinatown in major US cities. In sum, Augusta could see improvements in environmental efforts, similar to cities in the US. The city does outperform on healthcare comparatively speaking, but what makes the city truly remarkable is its arts and culture.
References
Brulle, R. & Pellow, D. (2006). Environmental justice: Human health and environmental inequalities, Annual Review of Public Health, 27, 103-124. doi:10.1146/annurev.publhealth.27.021405.102124
English, M., Peretz, J., & Manderschied, M. (2004). Building communities while building plans: A review of techniques for participatory planning processes. Public Administration Quarterly, 26(3), 503-539. Retrieved from https://www.jstor.org/stable/41288182
Fung, A. & Wright, E. (2001). Deepening democracy: Innovations in empowered participatory governance. Politics & Society, 29(1), 5–41. doi:https://doi.org/10.1177/0032329201029001002
Green, P. & Haines, A. (2016). Asset Building & Community Development (4th ed.). SAGE Publications.
Sen, A. (2004). How does culture matter? In V. Rao, & M. Walton (Eds.), Culture and Public Action (pp. 37-58). Stanford University Press.
According to Rubin (2016), performance budget lists what each administrative unit is trying to accomplish, and with what resources. It further emphasizes getting the most service for the dollar. In the Performance Highlights on page 39, the City of Atlanta has noted a consistent growth of its population. Atlanta’s economy remains strong; in the budget of FY 20, it was pointed out that 8,756 new jobs were created that resulted in a 6% increase of permit quantity and over 27% increase in revenue between 2017 to 2018. The growth of jobs resulted in the growth of residents. When people received a job offer that will require them to move, they will be in the market for a new home. The first thing they want to see in a home is good proximity to essential businesses, school district, and a sense of community with clean streets, and that reflects well on the community leaders and fellow residents. While Atlanta noted in their performance highlight that they have seen over 1,408 new housing units created, and over 66% of those units are affordable housing, the amount of new job growth still overshadows the housing growth by around six times.
According to the summary of fund balance, Affordable Housing Funds have not seen an increase between FY 19 and 20. With a growing economy and population, Atlanta should focus on Community development; that is not only including the growth of its housing units, but also their living standards and presence. Plans to improve the general safety and appearance of the community are important to current and potential residents; as a result, they should be documented and evaluated. Community growth must meet its job growth. The city should care about building a healthy, cohesive, vibrant communities, which is a concept to promote a positive state of well-being among people within social and physical environments.
Proposed Goals for the Problem
A performance-based budget shows what government agencies are doing and provide a series of well-chosen benchmarks to tell how well they are doing it to demonstrate effectiveness (Rubin, 2016). My first proposal is that the city should decrease the number of abandoned structures over the years. In the city’s remediation strategy, Atlanta has the plan to construct a new park that will require demolition of abandoned structures (2018). The Enterprise Assets Management division will oversee the disposition of abandoned property (Atlanta, 2018). The city should consider that plan to be expanded the motion to demo abandoned structures to the whole jurisdiction and not solely where the new park would be.
Secondly, the city should collaborate with agencies, such as the housing authority, to develop legislation that identifies neighborhoods with high levels of abandoned structures, whether commercial, residential, or industrial. In order to achieve greater efficiency and effectiveness, Moving to Work (MTW) Program, administered by the U.S. Department of Urban Planning and Development, gave Atlanta Housing Authority (AHA) the flexibility to design and test various approaches to providing quality, affordable housing opportunities and promote self-sufficiency (AHA, 2018). The city should also promote a Neighborhood Watch in every community, which encourages neighbors to help neighbors. It further empowers them to take pride in the betterment of their community as they serve extra eyes and ears for safety or hazardous conditions. With these partnerships, the city should obtain the support it needs to identify areas that need redevelopment for the enrichment of the community.
Last, the city should issue citations against various violators for dilapidated houses, overgrown lots, and abandoned structures, and send court summons for severe or unresponsive violators. The Building Inspector or Code Enforcement Bureau should resolve nuisance abatement problems and work closely on related issues with citizens and city council members. They should also conduct housing inspections and work closely with the housing demolition program. The fines received for noncompliance should help alleviate the cost of drafting the legislation and execution.
Indicators for Performance
Performance-based analysis requires input measures that track the number of resources, money, time, labor, etc., allocated to a department to achieve the goal (Bland, 2013). The city should provide a timeline of a year to try and get violators and abandoned housing under control. To track the input measure, the city needs to calculate how much labor hours and resources that were reported by partnering agencies, such as the Code Enforcement Bureau and the AHA. As code enforcement will issue citations and summons, the city should also keep track of labor hours and resources spent at the courthouses. Any changes in quantities, magnitude, or value of FY 2018 benchmarks are due to normal year-to-year fluctuations in residents, households, or units that form the basis of inputs into the calculations.
On the other hand, the output measure quantifies the amount of work accomplished (Bland, 2013). In the MTW Annual Report, key measurements of success include the number of new affordable units, new homeownership, and dollar invested and leveraged in real estate development (AHA, 2018). A good efficiency indicator would be to see how many demolition permits were issued compared to all the abandoned structures that were listed by AHA. To evaluate the output from the Code Enforcement Bureau, we could measure how many violators became compliant to address to the issues out of the total amount of citations issued.
For the efficiency indicators, I propose the city to minimize expenses for private companies that are needed to revitalize communities, such as demolition companies, builders, landscapers, and other general contractors. It would be wise for a city to standardize costs for the demolition or construction company. This can be done by creating a scope of work with all the anticipated demolition jobs under one wholesale price for private companies to submit their bids. Another way to improve efficiency is to incentivize tax benefit on private companies who involve in projects related to affordable housing.
With all the indicators in place, the city of Atlanta should establish trackable goals and measure their performance in a certain timeframe. As it could be a time-consuming process, from identifying an unkempt property, to working with its owner to address the issue, to planning redevelopment with the AHA, the city should give itself a goal for each phase. An example that I propose for the city is to increase the demolition counts for abandoned structure by 20% for every year for five years, with an aim to redevelop over 75% of underutilized space in five years. The city should further refine the percentage and the time frame after reviewing its historical data and deciding how much budget it can allocate to support the process financially. An unorganized way to approach issuing citations, redevelopment of space, and court hearings can prolong the service time. Document the time laps and identify the area of the slowdown and work ways to improve efficiency.
Lastly, to increase the public’s trust in the city’s service quality, the city of Atlanta could consider issuing a satisfaction survey of the community members, where abandoned places have been repurposed, and violators have become compliant. A survey should be available to the affecting residents over a span of five years to get their opinion on what they think about the changes in different communities and how it has affected them. An example would is to look at the frequency of a report from a Neighborhood Watch; with issues being addressed promptly, the city should see fewer reports on repeat issues.
Outcome Anticipated
Lastly, Bland (2013) stated that outcome measures demonstrate the impact of a proposed spending change on organizational or community conditions that will help those responsible for the budget to make better decisions and increase accountability, such as the efficiency and effectiveness of the government. While Atlanta is focused on providing more housing to its ever-growing population, policymakers should also consider the quality community instead of the quantity for its residents. Community-specific improvement has positive externalities for affordable housing levels and socioeconomic levels (AHA, 2018). As the community enriches, the city should see less in crime rate and a decrease in the number of 911 emergency calls. The city should also see a growth of population and economy as abandoned structures are removed for commercial and residential redevelopment.
With the help of the Code Enforcement Bureau, AHA, and Neighborhood Watch, the city will be able to provide a broad range of public services while protecting the health, safety, and general welfare of the citizens. The partnership effort will further increase the city’s ability to work as a team while setting a leadership example for the community. To summarize my performance-based budget, I compiled a logic model (reference Table 1.) which addresses the balance of the input, output, and outcome discussed in this paper.
Table 1.
Logic Model
Goal: -Enrich the existing community and thus increase the standards of living
-Redevelopment of underutilized urban spaces due to depilated structures
Objectives
Inputs
Outputs
Outcomes
-Identify abandoned or depilated structures in the city.
-Identify any building that may not be up to date on the current building codes.
-Hold private owners accountable for maintaining their property or ordinance in place.
-Establish and execute redevelopment plans geared towards the enrichment of the community.
-Participation from the Neighborhood Watch to report any unsafe or hazardous conditions.
-Collaborations with Code Enforcement Bureau to issue citations.
-Collaborations with the court and the justice system to fine and enforce violators to comply with code.
-Cooperation from private owners to keep their depilated structures up to code or remove it.
-Collaborations with the Enterprise Assets Management division to dispose of property if private owners forfeit their ownership.
– Partnership with the AHA to redevelop space after the abandoned structures are removed.
-Fulfillment from private companies that accept AHA’s work order to revitalize the community.
-Increase reports of noncompliance from uniformed Neighborhood Watch in different regions of the city.
-Issue warnings and citations to violators.
-Increase permit for demolitions or constructions.
-Removal of abandoned structures.
-Increase the number of fines collected from code violators.
-Increase the redevelopment of underutilized spaces for residential or commercial growth.
-Increase new homeownership.
-Increase in return on investment from housing growth.
-Increase in safety and satisfaction rating in surveys to communities.
Short-term: Fines collected from citations can be used to fund the urban redevelopment or affordable housing program.
Medium-term: With abandon structures removed, the overall safety of the dwellings in the community will increase, and more space can be repurposed, which can benefit both residential and commercial development. In short, it will increase the real estate market value. Long-term: Promotion of partnership between different agencies, will help the continual growth of community livelihoods and set precedents of future residents and discourage them from not taking care of their properties.
Note. From “Performance-Based Budgeting: Atlanta, GA, Community Development” by Chen, S., 2020, Augusta University.
Having reliable and affordable health insurance is crucial in order for a person to maintain health. While having health insurance is a commodity in developed countries, the health system of the U.S. is mostly designed under a capitalist structure, where private, for-profit companies dictate benefit packages that are not suitable for all people. In this paper, I will interpret the healthcare system in the U.S from scholarly research articles. Also, I will note the efficacy of the healthcare system compared to other countries. Lastly, I will identify who the uninsured and underinsured groups are and address the way that our government has reformed our healthcare system.
In the U.S., the health system operates in a complex institutional set-up with public or private mixed sectors (Zhu & Johansen, 2014). For Americans covered by the private sector, they are dependent on their employer for the coverage (Martin & Martin, 2011). Private sectors such as United HealthCare, Blue Cross Blue Shield, and Cigna work with large companies to develop benefit packages. Furthermore, the government-mandated all companies offer extended benefits without employment, such as the Consolidated Omnibus Reconciliation Act (COBRA), which is limited and often expensive (Martin & Martin, 2011).
On the other hand, there are public sector healthcare systems in the U.S., such as Medicare, Medicaid, or Children’s Health Insurance Programs (Zhu & Johansen, 2014). The public healthcare programs are not accessible to all general public because they aid those who cannot provide for themselves. Medicare is for all citizens who are 65 and older, regardless of income. Medicaid, on the other hand, is a federally established but state-run health insurance program that is dedicated to the poor and disabled (Kraft & Furlong, 2018).
The American healthcare system is not very effective, considering its limited and uneven service to the general public. Zhu and Johansen’s study found that there are significant inequalities and disparities in coverage across different levels of income groups (2014). Both public and private healthcare systems have flaws. The public healthcare systems have a funding structure that varies across states because each state can budget differently on how much public health insurance is provided (Zhu & Johansen, 2014). The private healthcare system is tied to one’s employment, and thus could be instable as the job market and the economy fluctuate (Martin & Martin, 2011). People may lose employment due to unforeseen reasons; COVID-19 serves as a great example as the employment rate is at a historical record high. It is common for those who became unemployed or underemployed to lose their health benefits and default on the payments for their home (Martin & Martin, 2011). Since COBRA is expensive and limited, as previously stated, it is counter-intuitive for people who are unemployed or underemployed. It is common for a U.S. citizen to file bankruptcy over medical expenses, while it is rare for other developed countries.
Compared to other industrialized and developed countries, the U.S. is the only one that does not have a national healthcare system. Zhu and Johansen (2014) have noted in their study from other researchers and conclude that public-public partnerships are efficacious at enhancing equity in public service compared to public-private partnerships. Other private employers in other industrialized countries around the world do not pay for health insurance, because it is provided uniformly by a national sector. Martin and Martin identified that, in those countries, “publicly managed health insurance is typically extended to all citizens and legal residents. Australia’s Medicare, Canada’s Medicare, the United Kingdom’s National Health Service, and Taiwan’s National Health Insurance are examples of single-payer universal health care systems” (2011, p.151).
Aside from people who lost their job due to economic failure or disability, not all companies in the U.S. offer health insurance benefits for their employees; for those reasons, many are often uninsured or underinsured. Since the market systems of the U.S. do not guarantee everyone to have access to healthcare, the government steps in to correct market failures (Kraft & Furlong, 2018); as a result, policymakers have taken a role to reshape American healthcare reform. Both the public and private healthcare sectors were actively involved in negotiations that ultimately led to the establishment of the Affordable Care Act in 2010, colloquially known as Obamacare (Kraft & Furlong, 2018).
During the deliberation, private insurance companies lobbied for the individual mandate under Obamacare. While the private sector helped retain security for themselves as they faced changes in practices and finances (Kraft & Furlong, 2018), their involvement has shaped the public healthcare system. Private health care plans emerged earlier than public programs in the United States. Soss and Moynihan (2014) identified from other political analysis in their studies that state officials adapted in ways that unfortunately resulted in a fragmented healthcare system, which is expensive and its implementation undercuts the constituency for reform while raising the political costs of policy change. Policy reformers eventually were pressured to focus on residual populations left out of private coverage (Soss & Moynihan, 2014).
Obamacare fixes the problem of the variability and inconsistency of medical coverage within states to adopt universal health insurance coverage (Zhu & Johansen, 2014). However, it was still only catered towards a particular group of people like Medicaid. By setting quantitative income eligibility limits, not all citizens who are socially and economically marginalized will be able to receive Obamacare (Zhu & Johansen, 2014). One of the social issues regarding inequity is the infamous Medicaid gap, where people are still uninsured because they are too poor to pay for private health insurance but make too much income to qualify for Medicaid.
In conclusion, healthcare insurance in the U.S. is a complex system that involves both the public and private sectors. While the U.S. has a public insurance program, it is not available to all citizens, unlike universal healthcare in other developed nations, such as the U.K. or Taiwan. While American policymakers have started to focus on national health insurance in recent reforms, future work needs to consider reducing inequality in health insurance coverage directly.
Reference
Kraft, M. & Furlong, S. (2018). Public Policy, Politics, Analysis, and Alternatives (6th ed.). Thousand Oaks, CA: C.Q. Press, an imprint of SAGE Publications, Inc.
Martin, E., & Martin, A. (2011). Economic crisis in the united states: Management strategies for a democratic economy. Public Administration and Management, 16(2),145-170.
Soss, J. & Moynihan, D. (2014). Policy Feedback and the Politics of Administration. Public Administration Review, 74. doi:10.1111/puar.12200
Zhu, L. & Johansen, M. (2014). Public responsibility and inequality in health insurance coverage: An examination of American state health care systems. Public Administration, 92(2):422-439. doi: 10.1111/padm.12083